
Reliability Prediction is one of the most common techniques used by engineers to evaluate product and system reliability. Reliability Prediction is a way to analyze an electro-mechanical system to determine its expected failure rate or MTBF (Mean Time Between Failures). In many cases, Reliability Prediction is one of the first tools adopted and becomes a central component of a comprehensive reliability and quality program. The ability to estimate failure rate and MTBF of your product during the design phase provides a powerful way to enable you to design-in reliability.
If you are new to Reliability Prediction, see our introductory article which covers the basics of Reliability Prediction.
In almost all cases, Reliability Predictions are performed using a software tool expressly designed for prediction analyses. To attempt to perform an analysis by hand is difficult and error prone, which is why analysts employ a Reliability Prediction software tool such as Relyence to evaluate MTBF. This article assumes that a Reliability Prediction analysis software tool is being utilized and describes some of the best techniques to practice with your tool of choice to ensure you get the most out of your Reliability Predictions.
The Steps of the Reliability Prediction Process
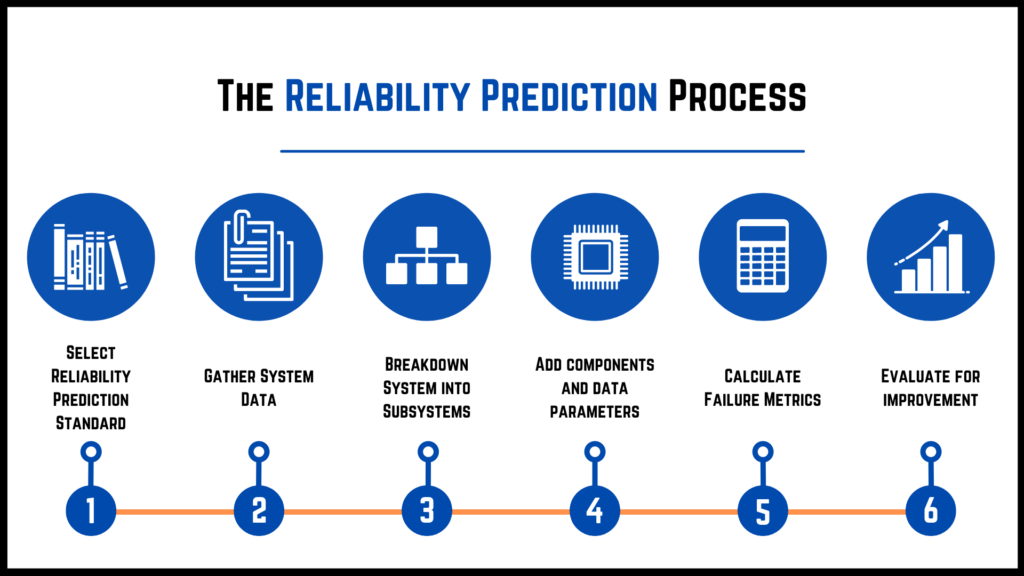
These six steps are the core of a best practices approach to performing Reliability Prediction analyses:
- Select Reliability Prediction standard: Choose the prediction standard or combination of standards that are most applicable for your requirements.
- Gather system data: Acquire all the necessary information about your product, including all subassemblies in your system and their component parts, as well as operating conditions. Data may be found in design documents, BOM (Bill of Materials) files, and from design engineers.
- Breakdown system into subsystems: Determine how you are going to break down your system into a hierarchical structure for analysis.
- Add components and data parameters: Add all the devices in each subassembly and the associated part data needed for analysis. You may be able to import this information from your BOMs and use databanks for data parameter retrieval.
- Calculate failure metrics: Compute failure rate and MTBF values for all the parts, subsystems, and the overall system.
- Evaluate for improvement: Review the results and make a plan for improvement if necessary.
1. Select Reliability Prediction standard
Your first step is to decide which Reliability Prediction standard or standards to use for your analysis. The most widely accepted Reliability Prediction standards include MIL-HDBK-217, Telcordia, 217Plus, IEC 61709, SN 29500, NSWC Mechanical, and ANSI/VITA. These standards include equations which model the failure rates of many electro-mechanical components. Statistical analysis of accumulated field data was used to generate the equations to best model the failure characteristics of the various device types. The choice of standard depends on your specific requirements. In some cases, it may make sense to employ a combination of standards.
For a deep dive into all the standards and their similarities and differences, refer to our in-depth guide.
2. Gather system data
The next step in the process is to gather information about your system. You need to find a source which includes all the subsystems and associated components that are used or planned to be used in your system. This information may be found in design drawings, CAD output, or BOM files. It is not an issue if you start with an initial list of subsystems and components and then revise as needed. Simply start with the known design information and update your analysis as design decisions become finalized. Reliability Predictions can be done at any point in the design process.
It is also important to gather details on the operating conditions of your system, such as the environment and temperature. Operating parameters may be obtained from design specifications, design documents, functional requirements documents, or by talking to design engineers and other product specialists.
3. Breakdown system into subsystems
Now you need to determine how you are going to break down your system into subsystems. You can create any number of levels of indenture and subassemblies depending how you think it is best to organize your analysis tree.
By establishing a structured system hierarchy, it will be easier to manage your analysis. It also provides a helpful way to track tasks if different teams are responsible for different subsystems.
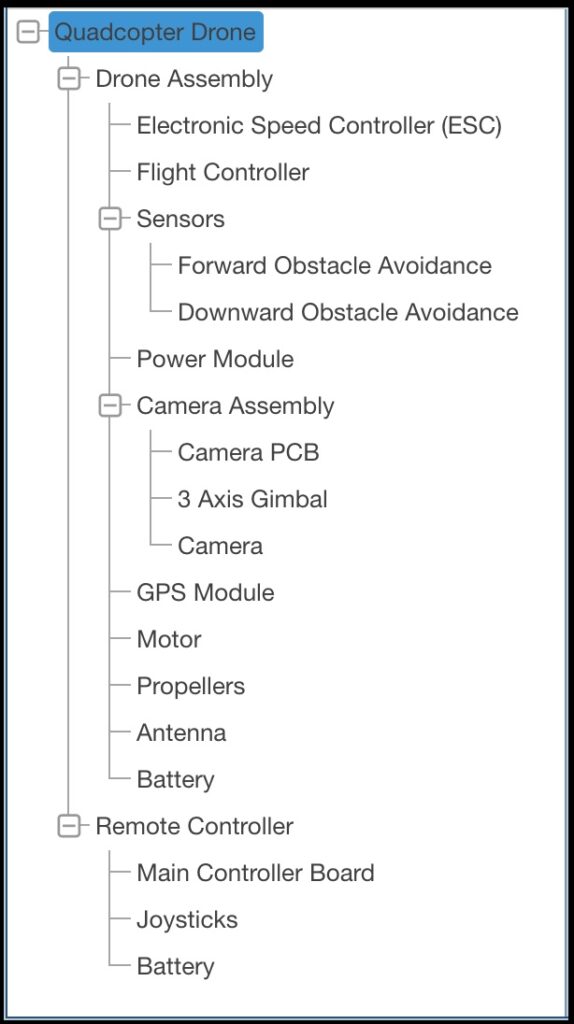
Example system breakdown for analysis of a drone.
4. Add components and data parameters
Once your system structure is established, you then proceed to add the list of devices in each subsystem. Then for each device, you enter the data parameters needed to evaluate the equations from the Reliability Prediction standard. The data parameters required vary depending on the standard being used and the device being modeled. For example, the data parameters needed to model an integrated circuit using MIL-HDBK-217 include:
- Package Type
- Technology Type
- Number of Gates
- Number of Pins
- Years in Production
- Quality Level
- Temperature Rise
This data can be found in various sources, such as BOM files, design documents, manufacturers’ data sheets, and from design engineers.
5. Calculate failure metrics
Once all data has been entered, you perform the Reliability Prediction calculation. The results of a Reliability Prediction analysis include the failure rates of all the components in your system, each subsystem’s failure rate, and the overall system failure rate. Typically, the sum of all components’ failure rates is the subsystem failure rate, and the sum of the subsystems’ failure rates is the overall system failure rate.
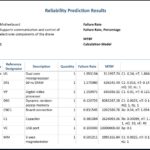
Example Reliability Prediction Report
6. Evaluate for improvement
The last step of the process is to step back and review the Reliability Prediction results. Does your system achieve your designated performance objectives? Is the predicted failure rate within an acceptable range? Is the predicted failure rate of the second-generation design lower than that of the original design?
Because systems can be vastly different in terms of composition and use, there is no defined cross-industry failure rate specification. However, for most systems, there is a target failure rate identified either internally or by the customer which is considered acceptable. Sometimes there may be a compliance requirement for total MTBF that must be met.
If your goals are not met, the Reliability Prediction analysis provides a wealth of information to enable you to zero in on areas that need improvement. One of the foremost advantages of Reliability Prediction analyses then becomes apparent – you can simply go in and test out various design changes and see how your failure rate changes. This is the process of performing What-If? studies and designing in reliability, which is a key benefit of Reliability Prediction.
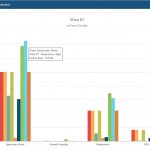
The Relyence Reliability Prediction Dashboard offers the unique What-If? widget for a great overview of all your What-If? trade-off studies.
Reliability Prediction analyses are essential in helping you achieve your MTBF target and can also aid in new product development to ensure new designs achieve or surpass previous baselines. For a more insight into the Reliability Prediction process, see our MTBF Analysis in Six Steps article which provides a detailed guide of the steps outlined here.
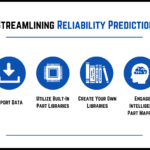
Streamlining the Reliability Prediction Analysis Process
Reliability Prediction analysis can be a time-consuming task. Certain specific steps of the process can be challenging, such as data gathering and data entry. However, when using a tool such as Relyence Reliability Prediction, there are several features which make these steps much more efficient and manageable. Important ways to streamline your Reliability Prediction analysis process include:
- Use default data values
- Import data from outside sources
- Utilize built-in Part Libraries
- Create your own Part Libraries
- Engage Intelligent Part MappingTM
- Build up Knowledge BanksTM
1. Use default data values
As mentioned, one of the benefits of Reliability Prediction analysis is that it often is performed prior to final product design to give an early indication of system failure rate. In this way, it can be used to help guide decisions in the design stage in order to ensure reliability performance goals will be met. However, this means that all required data parameters used to model device failure rate may not yet be available or known.
Fortunately, with Relyence Reliability Prediction, you do not need to enter data for each parameter. You can fill in as much information as you have and leave other values blank. Then you can return later and fill in the missing data as it becomes available.
For unavailable data, Relyence Reliability Prediction will use average default values as a basis for calculations. When using a standard which includes a Parts Count methodology, Relyence will use the values that are specified there. Reliability Prediction Parts Count methods require much less data and instead use accepted averages as default values for most parameters for analysis. Typically, Parts Count techniques are utilized in early design when data is not yet available. Then as a design matures, you move on from using Parts Count to using the customary part of the standard, otherwise known as Part Stress. For more information on Parts Count and Part Stress methods, refer to our guide.
Additionally, if you prefer to use your own set of default values, you can create your own databank of default values to use with Relyence.
2. Import data from outside sources
Another time intensive task is entering your system data for your Reliability Prediction analysis. This work is easily simplified by using the Import feature. In Relyence Reliability Prediction, the import capability is presented in a step-by-step Wizard format to guide you through the import process. This is a commonly used means of gathering data for your analysis – obtain a BOM file for your product and import the data directly into Relyence.
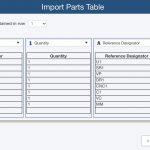
The Relyence Import Wizard provides a step-by-step walkthrough for importing part data, such as your BOM, into Reliability Prediction.
Once imported, your Parts Table is populated with all the components of your system. You can then proceed to add in data parameters as needed, and then move to failure rate calculations.
3. Utilize built-in Part Libraries
Much of the part data needed to perform a Reliability Prediction analysis can be found in manufacturer’s data sheets of the devices in use. This applies to data such as rated voltage, rated power, and power dissipation, along with various others. Relyence Reliability Prediction includes a large built-in component database with this information. So as parts are imported or manually entered, this information is automatically retrieved and recorded for you. For example, you can enter a manufacturer part number such as 74LS00 and Relyence’s built-in Part Library will retrieve the known data parameters.
Relyence Reliability Prediction also supports the NPRD (Non-electronic Parts Reliability Data) and EPRD (Electronic Parts Reliability Data) databases. These databases represent an extensive list of components and their associated failure rates based on captured field data. You can utilize the NPRD/EPRD to augment your Reliability Prediction analyses to incorporate failure rates for devices not included in the standards, or for those you prefer not to model with the standards.
4. Create your own Part Libraries
In a similar fashion to the built-in Part Library, you can create your own Part Library. This enables you to create a database of devices and device parameters that can be automatically searched during data entry. This database can include parts commonly used in your designs, which allows for easy retrieval and reuse of known component data. By using a combination of the built-in Relyence Part Library and your own Part Library, a significant portion of data parameters needed for your analysis can be automatically retrieved, resulting in huge time savings.
5. Engage Intelligent Part Mapping
A unique to Relyence capability, Intelligent Part Mapping is an innovative feature to decode Part Descriptions to extract part data. The data gathered from the Part Description is then automatically added to the data parameters for the part. A few examples of Descriptions that Intelligent Part Mapping will recognize include:
- CAP CER 10uF 50V
- RCR 5W
- Zener
- FPGA
- CERM 0.2 pF
Example of Intelligent Part Mapping for “CAP CER 10uF 50V” Description Entry
This feature greatly improves the efficiency of part data entry. It is used during data entry and data importing to extract as much information as possible.
6. Build up Knowledge Banks
Knowledge Banks are another innovative Relyence-only feature. Relyence Knowledge Banks support data reusability in a clear, effective manner. It is a powerful approach for improving your Reliability Prediction analysis efficiency and offers a way to expertly manage and organize your data.
For example, you may have a subassembly used across multiple product lines. Or you may use subassemblies from prior designs in next generation projects. The Relyence Knowledge Bank replaces the cumbersome and error-prone copy-and-paste method of managing reused subassemblies. You store the component information once in the Knowledge Bank and then reference it wherever needed. Also, if updates are made to subassemblies in your Knowledge Bank, you can choose to update your Analysis with the changes to keep your reused data in sync.
A description on establishing and using Knowledge Banks can be found in our tutorial. A key advantage of Knowledge Banks is that they grow over time and become a powerful resource for future analyses, enabling you to leverage your data for maximum efficiency.
For more details on all the ways Relyence Reliability Prediction improves analysis efficiency, review our expansive white paper.
How Does Reliability Prediction Fit into My Overall Reliability Toolset?
It is part of a best practices approach to encompass Reliability Prediction into your organization’s overall reliability and quality program. Though Reliability Prediction can certainly be performed in a stand-alone manner solely for MTBF analysis, it is when incorporated into your overall platform that you gain further benefits.
Reliability Prediction analysis provides a framework for product improvement beyond just failure rate and MTBF analysis. You can build on the data you’ve captured in your Reliability Prediction analysis to perform additional analyses. In this way, you can build on your Reliability Prediction analysis investment to gain more insights for reliability and quality improvement.
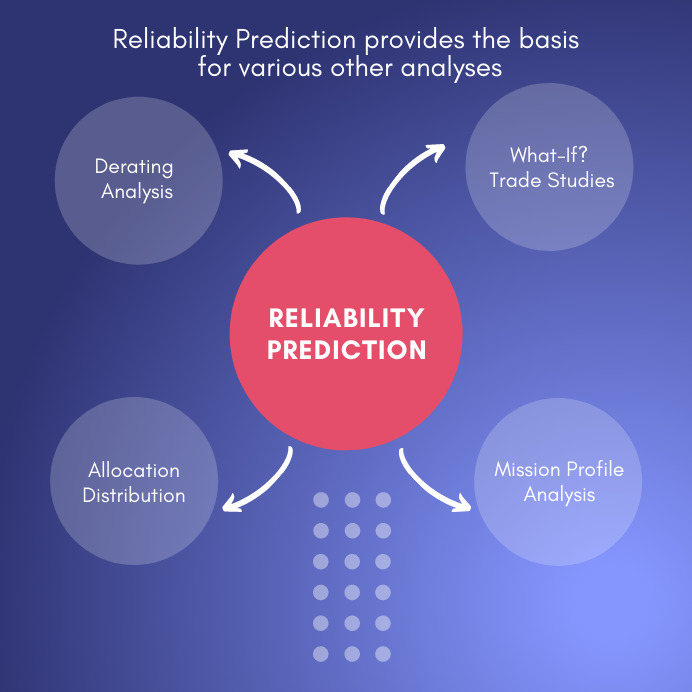
Using Reliability Prediction Results as a Basis for other Analyses
There are several other types of analysis that are often considered as part of a well-established reliability program that can be performed based on data from your Reliability Prediction analyses:
- Derating Analysis: Evaluate the operating stresses components are subjected to and identify those that are above acceptable levels.
- Allocation Analysis: Determine how to optimally distribute reliability goals across a system in order to meet overall reliability objectives.
- Mission Profile Calculations: Analyze the likelihood of mission success.
- Trade Off, or What-If?, Studies: Evaluate design alternatives and their effect on product reliability.
For more information about each of these techniques, our white paper offers a comprehensive review.
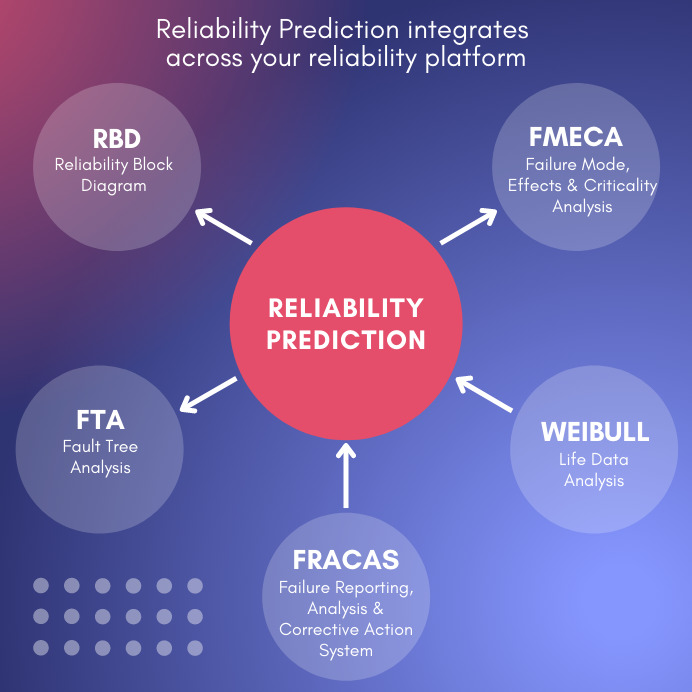
Integration with other Reliability Tools
Another best practice approach is to incorporate Reliability Prediction analysis into your complete reliability and quality toolset. Reliability Prediction analysis is most beneficial when used in an integrated manner with your other reliability analysis tools. Not only does this ensure the most efficient data management, but it also supports a collaborative teamwork approach. Relyence Studio offers an integrated platform for all your reliability analysis activities.
A few analyses commonly used in conjunction with Reliability Prediction include:
- RBD, or Reliability Block Diagram
- FMECA, or Failure Mode, Effects, and Criticality Analysis
- Fault Tree Analysis, or FTA
- Weibull, or Life Data Analysis
- FRACAS, or Failure Reporting, Analysis, and Corrective Action System
Our white paper provides specific details on how Reliability Prediction can be integrated with other tools.
Conclusion
Relyence Reliability Prediction offers a comprehensive platform supporting all the best practices for completing your Reliability Prediction analyses. With Relyence, the Reliability Prediction process is streamlined for utmost efficiency. Plus, Relyence Reliability Prediction is part of the comprehensive Relyence Studio platform, enabling you to perform all your most important analytics on one platform.
Contact us today to discuss your Reliability Prediction needs and learn how Relyence Reliability Prediction can help. Or sign up today for our free trial to test drive Relyence Reliability Prediction yourself.