We’re hitting the ground running right out of the gate in 2019! We’re proud to introduce our latest Relyence release, which includes a host of new features and capabilities to further round out our groundbreaking reliability and quality software platform.
Relyence 2019 Release 1 introduces two new additions to our product lineup: Relyence Maintainability Prediction and Relyence Weibull. Relyence Maintainability Prediction provides support for maintainability prediction analyses based on MIL-HDBK-472, complete with Task and FD&I (Fault Detection and Isolation) Output support and an extensive set of repair metrics. Relyence Weibull supports complete life data analysis using Weibull techniques and couples impressive plots with an intuitive, easy-to-use interface.
To keep our commitment to providing the best-in-class tools for all your reliability analysis software needs going strong, we’ve also added new features across our Relyence tool suite. Relyence 2019 offers a revamped importing capability for smooth and simple data importing, support for Single Sign On (SSO), a new freeze column feature for tables, and more.
Read on for details on our shiny new release, or feel free to contact us today for a personal overview, or sign up for your own completely free test run.
Relyence Maintainability Prediction
System uptime and availability depend not just on high reliability, but also on an effective maintenance program – one that includes corrective and preventive measures and ensures fast and efficient repair procedures. Quantifying and tracking maintenance activities is a critical component in ensuring your reliability and quality system goals are attained. That’s the advantage of Maintainability Prediction Analysis – providing detailed analysis and measurement of your most vital maintenance actions.
Relyence Maintainability Prediction is based on the recognized standard for maintainability analysis: MIL-HDBK-472: Maintainability Prediction. MIL-HDBK-472 has its roots in Department of Defense applications, but is the singular standard that has long been in place for optimal maintenance analysis across any industry.
Maintenance Tasks, Maintenance Task Groups, FD&I Outputs, and Maintenance Groups
There are a number of components in performing a Maintainability Prediction Analysis based on MIL-HDBK-472 methodology. Relyence Maintainability Prediction supports all of them: Maintenance Tasks, Maintenance Task Groups, FD&I Outputs, and Maintainability Groups.
Maintenance Tasks and Maintenance Task Groups
Maintenance actions are defined by a list of basic tasks that define the procedure for repair or maintenance action. For example, something as basic as “remove screw” may be a basic task. Along with this basic task, you assign the time it takes to perform the task. You can build up a library of these basic tasks and then reuse them within your analysis.
In addition, you can define a task group, or multiple tasks performed together to complete a repair action, such as “replace motherboard”. For your systems, the steps required to replace the motherboard will be the same all the time – perhaps opening up a case, removing some screws or clips, swapping the board, and then closing the case back up. You can combine all those Tasks into a single Task Group to use in your analysis for quick and consistent measurement.
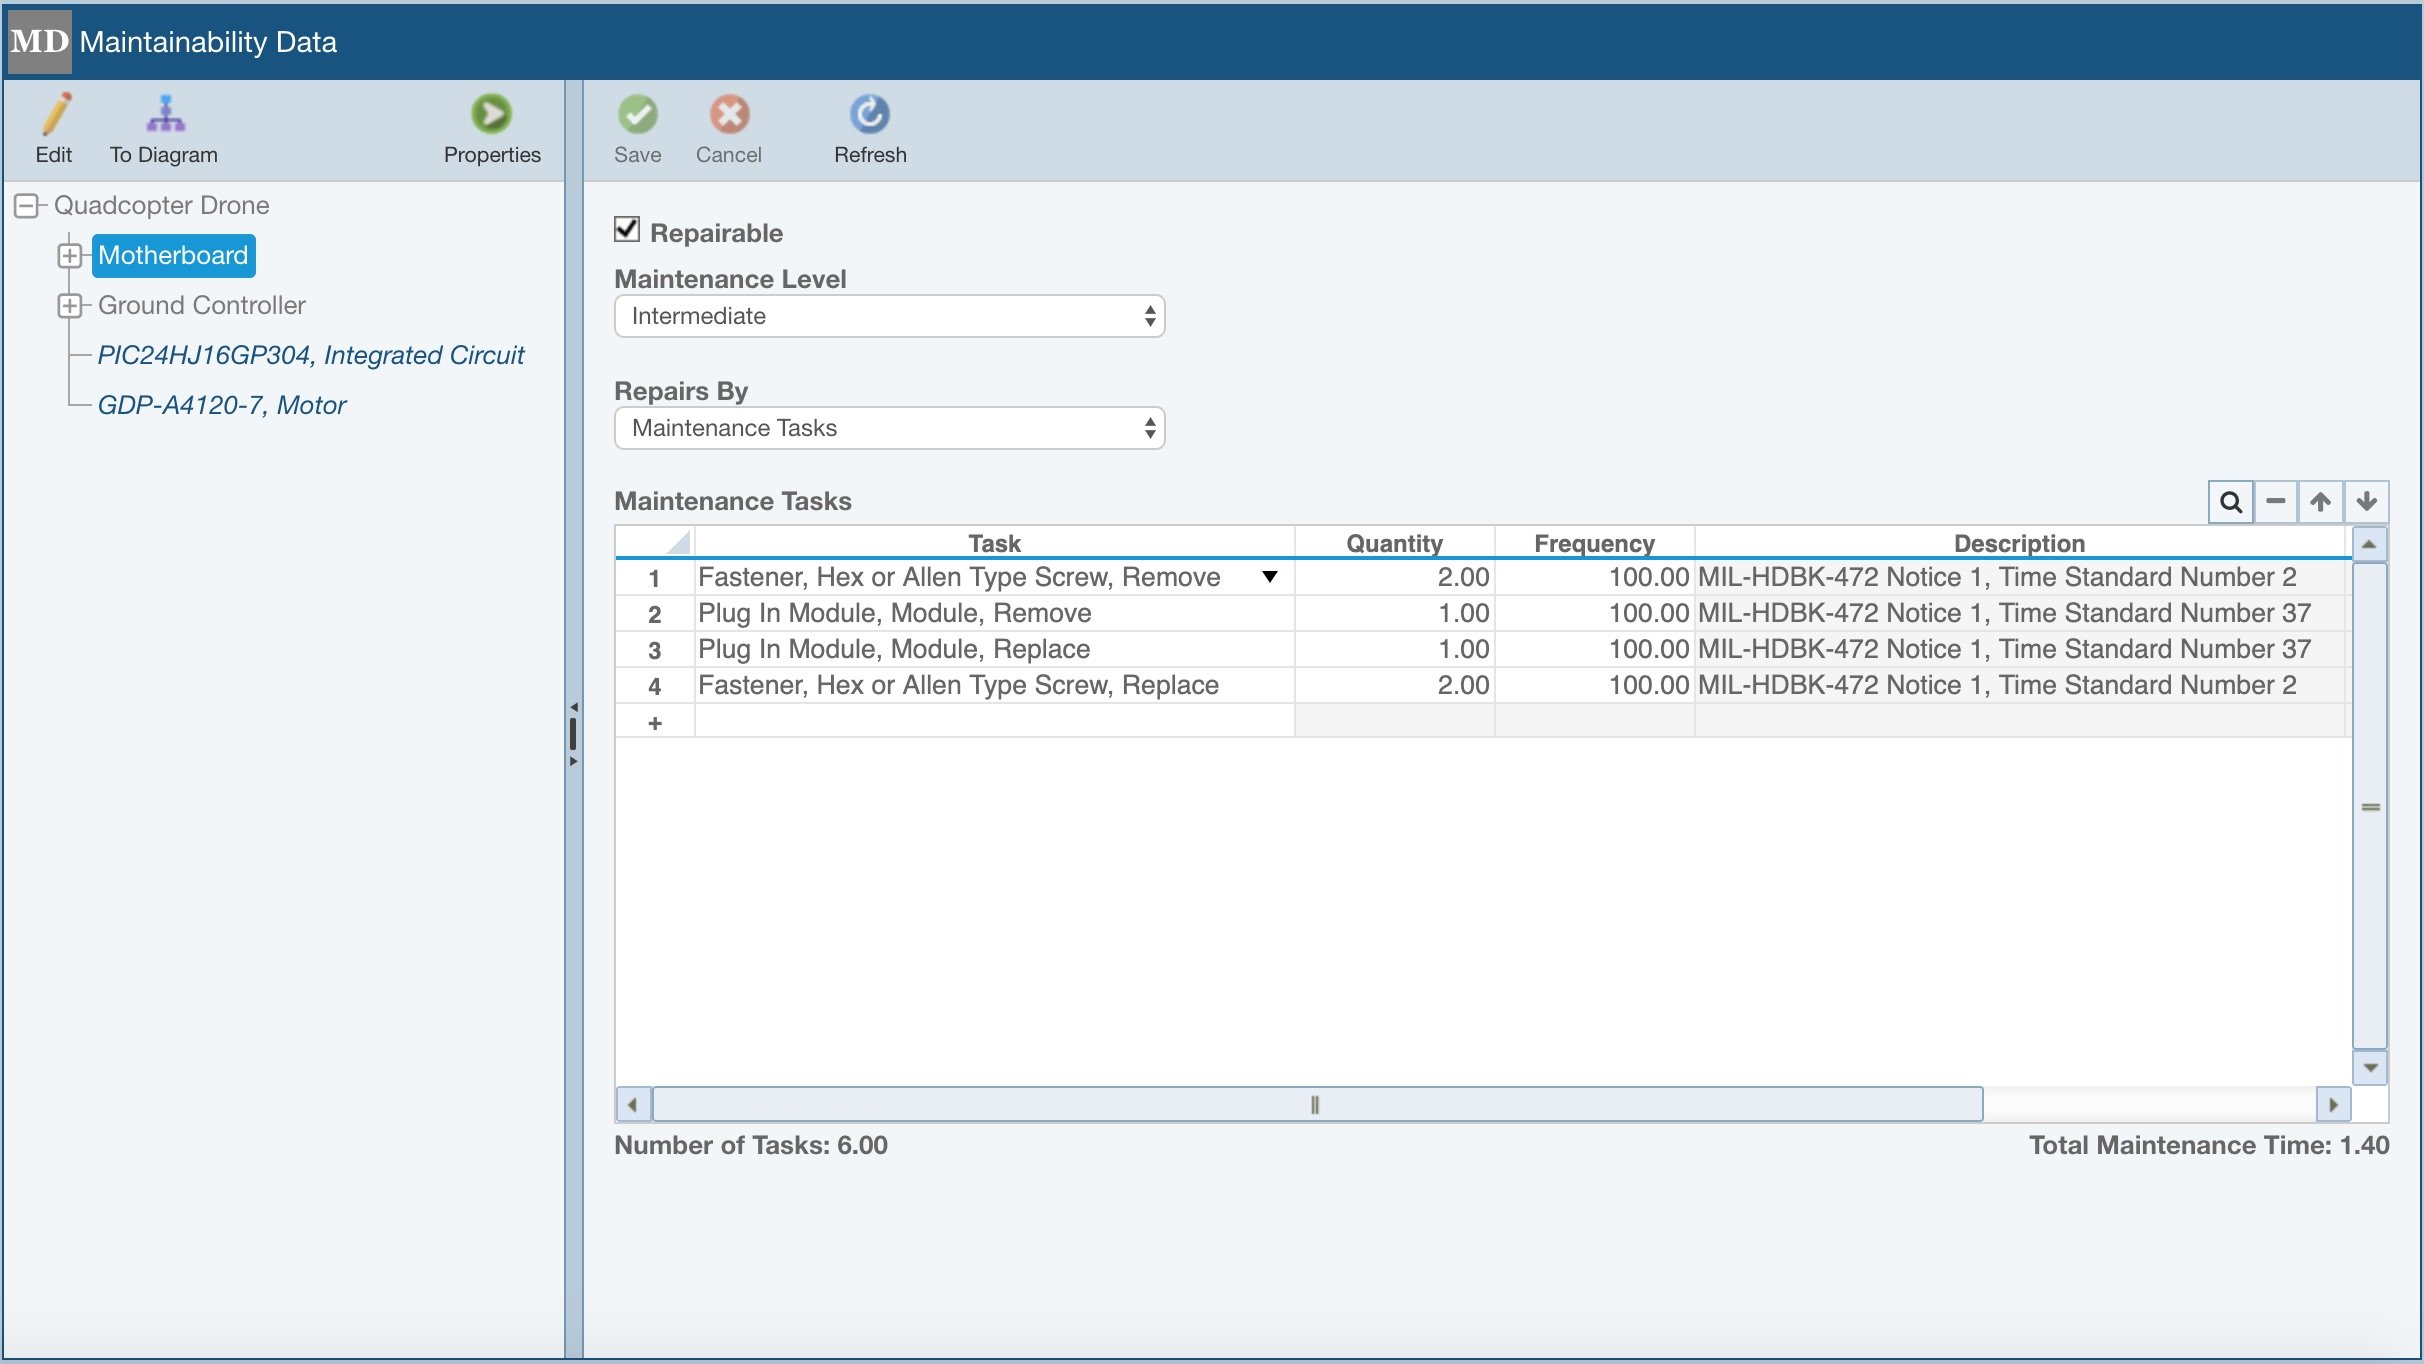
Relyence Maintainability Prediction allows you to define your maintenance activities by Tasks or FD&I Outputs.
FD&I Outputs
FD&I Outputs, or Fault Detection and Isolation Outputs, are the activities performed in order to detect and isolate a failed item. Similar to Task Groups, FD&I Outputs are typically defined as a group of tasks performed together as a unit.
Maintenance Groups
Maintenance Groups define how a repair action is performed on a group of items, rather than on a single item. Some of the data required to define a Maintenance Group includes the repairable item access (single or multiple items), the replacement philosophy (group or iterative), and if reassembly of the unit is required for checkout.
Maintenance Tasks, Task Groups, FD&I Outputs, and Maintenance Groups can be considered the building blocks for the Maintainability Prediction Analysis. Once these are in place, you can then go step-by-step through the components in your system and describe the process and procedures required to repair and replace failed items.
Maintenance Metrics
Once your maintenance activities are defined, you can then proceed to the central part of your analysis: computing maintenance metrics. Using MIL-HDBK-472 as a basis, Relyence Maintainability Prediction offers a host of metrics for assessment of your system’s repair statistics.
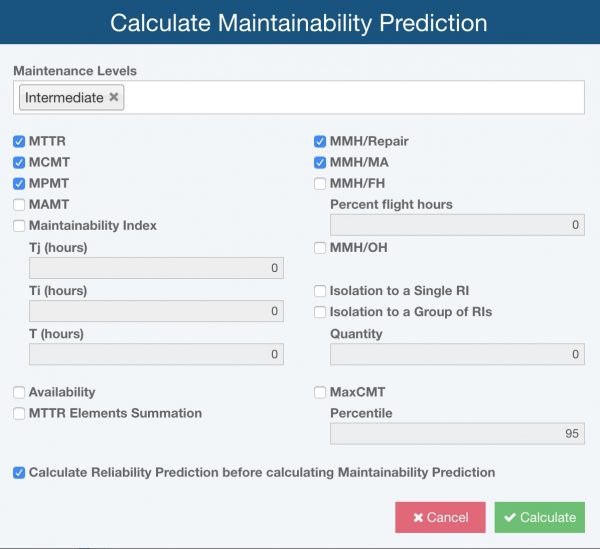
Relyence Maintainability Prediction supports a wide range of repair metrics.
Relyence Maintainability Prediction supports the following metrics:
- MTTR: Mean Time to Repair
- MCMT: Mean Corrective Maintenance Time
- MPMT: Mean Preventive Maintenance Time
- MAMT: Mean Active Maintenance Time
- MMH/Repair: Mean Maintenance Hours per Repair
- MMH/MA: Mean Maintenance Hours per Maintenance Action
- MMH/FH: Mean Maintenance Hours per Flight Hour
- MMH/OH: Mean Maintenance Hours per Operating Hour
- Isolation to a Single RI: Percent isolation to a single replaceable item
- Isolation to a Group of RIs: Percent isolation to a group of replaceable items
- MaxCMT: Maximum Corrective Maintenance Time
- Maintainability Index
- Availability
- Individual MTTR Element Values: The summation of the results associated with Preparation, Fault Isolation, Disassembly, Interchange, Reassembly, Alignment, Checkout, and Start Up.
Additional Capabilities
Relyence Maintainability Prediction includes full customizable reports, a unique Tasks search feature, and seamless integration with Relyence Reliability Prediction for combined failure and repair metrics in one tool.
Relyence Maintainability Prediction is packed with all the features you expect from the Relyence product line. It exhibits the classic design of the Relyence platform: ease-of-use in conjunction with powerful capabilities, and anytime, anywhere access.
Relyence Weibull
Weibull analysis is a methodology for analyzing various types of life data in order to predict failure trends. Weibull analysis is based on high-powered statistical analysis using different distributions, including, most notably, the Weibull distribution. The Weibull distribution is especially significant due to its versatility and its ability to model life data. It is one of the most widely used mathematical techniques for evaluating life data across a range of industries and across the product lifecycle.
The core principle in Weibull analysis is to gather a sample set of life data, or data about failures over a time frame, and then apply Weibull techniques in order to fit the data to a distribution. Using this information, you can then extrapolate to evaluate trends, assess the probability of a system operating over a time interval, analyze the mean life of a system, predict failure rate, or even determine a warranty period.
Relyence Weibull allows you to enhance the capabilities of your reliability software toolset by taking advantage of Weibull techniques in your analyses. Relyence Weibull supports complete life data analysis, including all the most widely used distributions, such as Weibull, Normal, Lognormal, and Exponential. In addition, it enables you to extend this information to your other Relyence analysis tools for even more powerful and accurate reliability analyses.
Relyence Weibull supports full life data analysis with built-in best fit distribution analysis.
Best Fit Distribution Analysis
Relyence Weibull includes a Best Fit feature that automatically assesses the best fit distribution for your failure data. The Best Fit feature is a useful tool when you are unsure of which distribution to use. Or, you can also select a distribution and the Best Fit analysis will help you see how close your selected distribution matches the best fit choice.
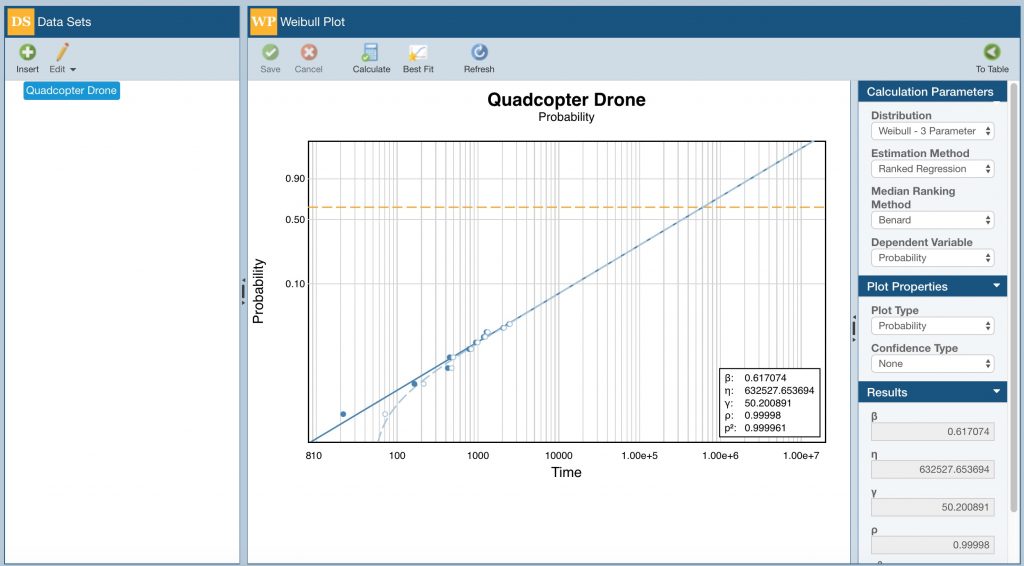
Weibull Plots
A central component of Weibull analyses are Weibull plots, or the resulting graphical representation of your failure data along with the distribution curve. Weibull plots are a vital element of Weibull tools, allowing you to visually see your life data along with the distribution line for full understanding of trends and future performance.
Relyence Weibull supports a number of plot types including Probability, Reliability vs Time, Unreliability vs Time, Failure Rate vs Time, and PDF (Probability Density Function) plots. You can also add upper and/or lower confidence bounds to your plots, as well customize the legend and plot headings.
Integrating Relyence Weibull with Other Relyence Products
To extend the already powerful abilities of Relyence Weibull, it seamlessly integrates with other Relyence products for more all-encompassing analyses.
You can tie a particular item in your Reliability Prediction analysis to a Weibull Data Set. In this case, you can use your life data to predict failure rate in place of modeling with the equations from the reliability prediction standard.
Additionally, you can link an item in your RBD (Reliability Block Diagram) to a Weibull Data Set. The block properties and resulting failure related metrics will be based on your life data for this block.
As an added bonus, you can even create a complete Weibull Data Set from your captured FRACAS (Failure Reporting, Analysis, and Corrective Action System) data. This unique combination allows you to automatically convert the life data contained within your FRACAS for use in Relyence Weibull. You can then analyze your Incident data using Weibull techniques to perform trend analysis and predict future system performance.
As with all Relyence products, Relyence Weibull is an integral part of the Relyence platform and is a component of our Relyence Studio integrated tool suite. It exhibits all the unique design elements and powerful capabilities that you expect from the Relyence brand.
Other New Capabilities
Data Importing
Relyence 2019 Release 1 includes an all-new, step-by-step guided approach for data importing. The unique Relyence smart-mapping feature enables you to easily import data from your Excel spreadsheets. You select a spreadsheet and then Relyence’s smart-mapping goes to work reviewing the information and intelligently mapping your data to Relyence data fields. Any unrecognized fields are automatically highlighted for you, and you can choose to skip unmapped fields or map them to Relyence fields.
In addition, you can save your Imports for easy reuse, or to share with team members.
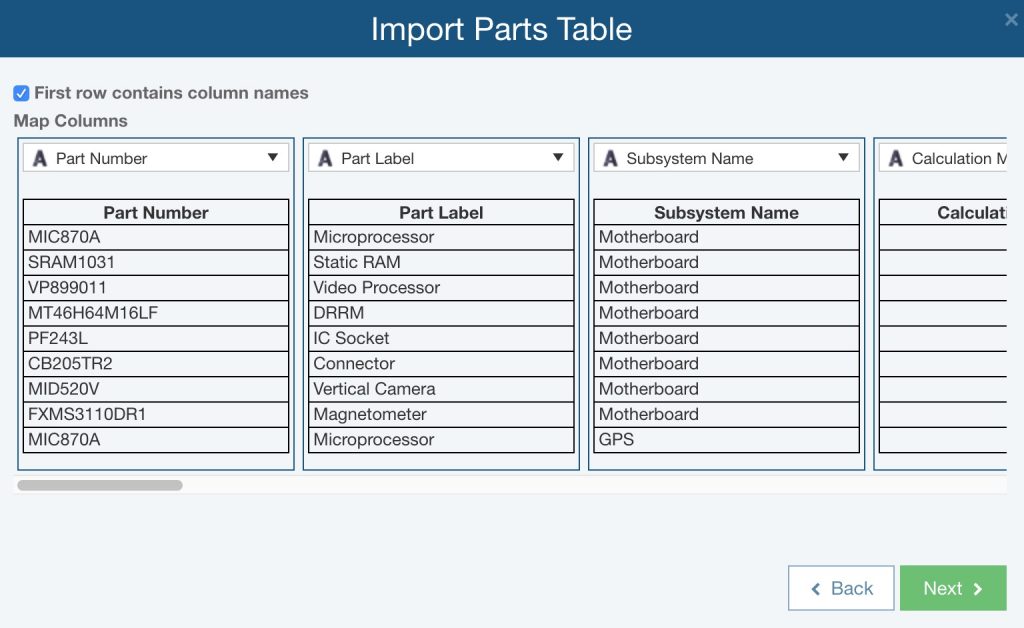
Relyence’s smart-mapping feature during data import automatically maps your data fields for you.
Single Sign On
Single Sign On (SSO) is a process that allows you to use a single user account, or username and password, to sign in to multiple applications that you use. In this case, the support for SSO in Relyence means that you can use your organizational login credentials when accessing Relyence; you do not need a separate username and password.
Relyence SSO is easy for your system administrator to enable for your organization. Once enabled and configured for your team, simply click the Use Single Sign On link on the Relyence Sign In dialog to sign in with your corporate credentials.
Column Freezing
All Relyence Tables have a handy new Freeze Columns capability to enable you to freeze a column or multiple columns on the left side of your Tables. As you scroll horizontally, the frozen columns remain in place while other columns scroll into view. Simply select a column and click the Freeze Columns icon in the toolbar of your Table to enable this feature.
Free Trial of Relyence 2019
We are excited about our latest release, and as always, we’re already hard at work on our next one! Creating is our passion and we love nothing more than building and delivering tools that meet and exceed your expectations. We strive to keep you front and center, and hope you continue to share with us your suggestions for new ideas and improvements.
Check out Relyence 2019! We offer a completely free, fully functional trial of our product line. Register today for your free test drive! Or call today to speak to us about your requirements, or to schedule a free webinar.