Reliability Prediction analysis is one of the primary techniques used in the reliability engineering field to compute the predicted failure rate of an electromechanical system. Sometimes referred to as MTBF Analysis, Reliability Prediction is a useful tool for evaluating system reliability. One significant advantage of Reliability Prediction is that it enables you to design in reliability. Because the analysis is predictive and can be done in the product design phase, you can make corrections before production in order to ensure your product will meet your reliability objectives.
Reliability Prediction standards define the statistical methods used to assess failure rate. There are a number of Reliability Prediction standards in use today, including MIL-HDBK-217, Telcordia SR-332 (formerly Bellcore), 217Plus, IEC 61709, SN 29500, NSWC Mechanical, ANSI/VITA 51.1, and China’s GJB/z 299. These standards provide equations to compute failure rates of various electrical and mechanical components. To perform a Reliability Prediction analysis, you describe all the underlying components in your system and their important characteristics. The Reliability Prediction engine then performs the necessary calculations to determine the overall failure rate and MTBF (Mean Time Between Failures) of your system.
Reliability Prediction tools evaluate failure rate assuming systems are in the “useful life” portion of their lifecycle. In this stage, the failure rate is assumed to be constant and the MTBF can easily be analyzed. This is why Reliability Prediction analysis is also referred to as MTBF Analysis.
One objective of Reliability Prediction analysis is to evaluate if the predicted failure rate meets your goals during the product design phase. If not, you can make design changes or determine other ways to improve your system reliability.

How Are Component Failure Rates Computed Using Reliability Prediction?
The failure rates of the electromechanical components of your system are computed using equations defined in the Reliability Prediction standards. These equations vary from standard to standard, but in general, they are mathematical equations that can be performed using algebraic techniques. The equations range from simple to complex depending on the type of component and the standard.
Example Failure Rate Calculation
An example equation from the widely used MIL-HDBK-217 standard depicts a good representation of a failure rate equation. The equation for modeling the failure rate of Microcircuits, Gate/Logic Array and Microprocessors is:
λp = (C1 * πT + C2 * πE) * πQ * πL
Where:
λp is the failure rate in failures/million hours (or failures/1,000,000 hours, or FPMH)
The factors in the equation are various operating, rated, temperature, and environmental conditions of the component. The following list describes the variables in the equation above:
- C1 factors in the complexity of the device, such as the number of gates or transistors
- πT factors in the ambient temperature and any temperature rise associated with the device
- C2 factors in the package of the device, or how it is manufactured and placed in the system, such as surface mounted and/or hermetically sealed
- πE factors in the environment that the device is operating in, such as in space, in an aircraft, in the sea, on the ground, etc.
- πQ factors in the quality of the device based on how it is procured
- πL factors in how long the device has been manufactured
Integrated Circuit Example
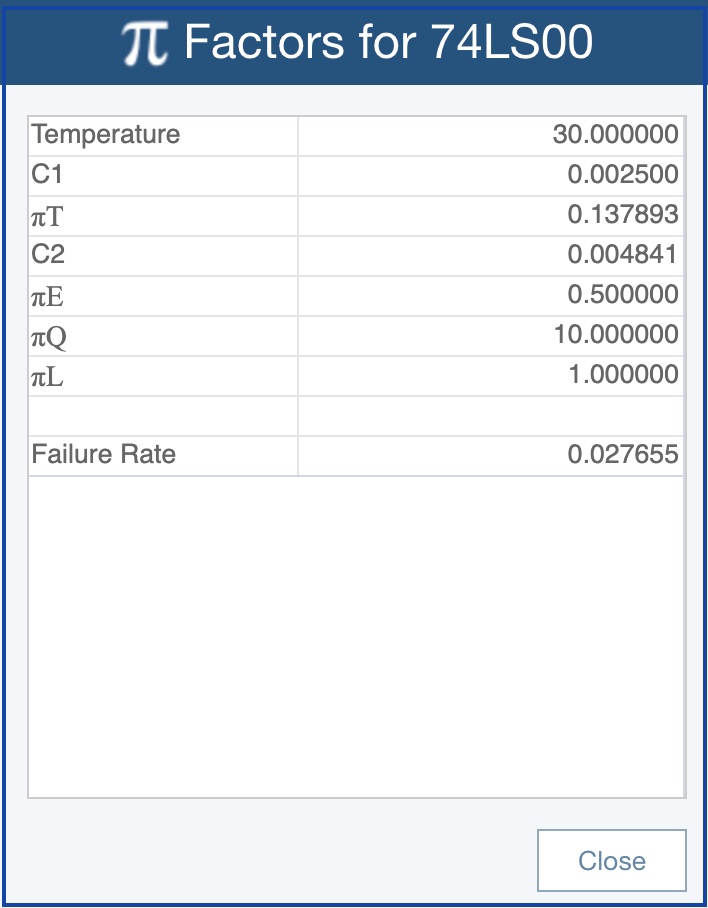
For example, if one of my components is a hermetically sealed 14 pin (C2), 4 gate LSTTL chip (C1 and πT), that has been in field use for many years (πL), is operating in a typical “ground” environment (πE) at 30 degrees Celsius (πT), and is procured at commercial level quality (πQ), its failure rate can be calculated using the above equation. Referring to the MIL-HDBK-217 standard, the elements of the equation, referred to as pi factors, can be determined. For this example, the pi factors are:
- C1 = 0.0025
- πT = 0.137893
- C2 = 0.004841
- πE = 0.5
- πQ = 10.0
- πL = 1.0
The resulting failure rate is:
λp = (0.0025 * 0.137893 + 0.004841 * 0.5) * 10.0 * 1.0 = 0.027655
This indicates that this part is estimated to fail 0.027655 times over a million hours.
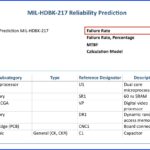
Example Failure Rate Calculation using MIL-HDBK-217
How Is System Failure Rate Computed Using Reliability Prediction?
Once all the component parts of your system are defined, the failure rate of each one is determined using methods similar to the example above. The next step of the process is to compute the overall system failure rate based on the underlying components. The methodology used to calculate the total failure rate depends on the techniques defined in Reliability Prediction standard in use.
System Failure Rate Equals Sum of All Components
In the simplest case, the total system failure rate is the sum of all the component failure rates. This is the typical case for MIL-HDBK-217 based Reliability Predictions. In the example shown below, we have a system comprised of a small number of components. Using MIL-HDBK-217 Revision F Notice 2, the failure rate of each of the parts is calculated and the overall failure rate is equal to the sum of all the failure rates of the parts.
Example Reliability Prediction Analysis Where System Failure Rate is Equal to the Sum of Component Failure Rates
System Failure Rate Computed Using a Statistical Approach
In some cases, the failure rate is determined by a statistical approach using Mean values, Standard Deviations, and Confidence Levels. This is the method used when utilizing the Telcordia Reliability Prediction standard. In this situation, the overall system failure rate is not a simple summation of the failure rates of component parts.
How is Total Failure Rate Computed with Telcordia?
With Telcordia, the calculation of system failure rate is a multi-step process:
- The Mean Failure Rate of each component is calculated. This failure rate will not be equal to the component failure rate computed by a different Reliability Prediction standard, such as MIL-HDBK-217, due to the equation differences between the standards. However, Mean Failure Rate computed with Telcordia is similar to the component Failure Rate computed with MIL-HDBK-217 as it is the failure rate calculated based on the equations defined in the standard.
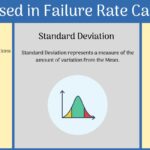
- For each component, subsystem, and the overall system, a Failure Rate Standard Deviation is determined. In statistical terms, standard deviation represents a measure of the amount of variation from the mean. A low standard deviation indicates that values remain close to the mean, while high standard deviation indicates a wide variation from the mean.
- The third element needed for system failure rate computation with Telcordia is the Confidence Level. The Confidence Level indicates the level of uncertainty you want to use for the calculations. For example, a 95% confidence level indicates that there is a 5% chance that the predicted failure rate underestimates the true failure rate.
- Using the Mean Failure Rates, the Standard Deviations, and the Confidence Level, the overall system failure rate is computed using the inverse gamma or inverse normal distribution.
In Telcordia, the failure rate is computed by:
λ(Confidence Level) = G-1 (P/100, K, θ)
Where:
- G-1 is the inverse cumulation distribution function of the gamma distribution for the given shape and scale
- K is the shape factor = (λ / σ)2
- θ is the scale factor = σ2 / λ
Where:
- λ is Mean Failure Rate
- σ is Standard Deviation
If the shape factor is greater than 100, the failure rate can be computed by:
λ(Confidence Level) = N-1 (P/100, λ, σ)
Where:
- N-1 is the inverse cumulation distribution function of the normal distribution with mean λ and standard deviation σ
- λ is Mean Failure Rate
- σ is Standard Deviation
Why is the Failure Rate of a System not the Sum of the Part Failure Rates Using Telcordia?
Because Telcordia uses the above method to compute failure rates at the part, subsystem, and overall system level, the overall system failure rate is not simply the summation of the underlying component failure rates. Rather, the resulting failure rates are determined based on the selected Confidence Level using Mean and Standard Deviation values. The example below shows the results of a system similar to the example above but using the Telcordia Reliability Prediction standard. The Confidence Level is set to 90% in this case.
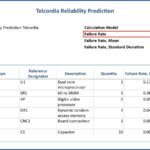
Example Reliability Prediction Analysis Where System Failure Rate Does Not Equal to the Sum of Component Failure Rates
You can see that the overall failure rate of 1.090743 does not equal the sum of the part failure rates. The system failure rate is obtained using the equation above:
λ(90%) = G-1 (P/100, K, θ)
Where:
- G-1 is the inverse cumulation distribution function of the gamma distribution for the given shape and scale
- K = (λ / σ)2 = (0.693563 / 0.296865)2 = 5.458253
- θ = σ2 / λ = (0.2968652 / 0.693563) = 0.127068
System Failure Rate with 90% Confidence Level = GAMMA.INV( 0.9, 5.458253, 0.127068) = 1.090743
However, note that the Failure Rate, Mean of the system is equal to the sum of the Failure Rate, Mean of the parts.

Failure Rate Adjustments Based on Influencing Factors
Additionally, there are cases where system failure rates are determined or modified based on other factors. In some situations, these adjustment factors are defined in Reliability Prediction standards. Also, Reliability Prediction software tools may allow you to adjust failure rates based on your own internal knowledge.
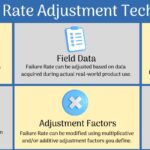
Adjustments Based on Lab or Field Data
One commonly used method for adjusting failure rates, defined in the Telcordia and 217Plus Reliability Prediction standards, is to augment Reliability Prediction failure rate assessments with laboratory test data or field-based data. This additional real-world information can help refine prediction estimates to reflect actual product performance.
In addition, Telcordia defines methods to incorporate burn-in data with Reliability Predictions, which can be helpful in early life failure rate analysis.
Adjustments Based on Process Grades
The 217Plus Reliability Prediction standard defines process grades, another method to augment failure rate evaluations. Process grades take into account such factors as the experience of the design team and product wear out to adjust failure rates accordingly.
Adjustments Based on Customer Defined Factors
In some cases, you may have a knowledge base of your own experience that you want to use to adjust predicted failure rates. For example, Relyence Reliability Prediction, offers the ability to adjust failure rates in several ways:
- You can override standards-computed failure rates with your own failure rate if you have a known value you wish to use.
- You can add multiplicative and additive adjustment factors to failure rates.
- You can use results from data analyses performed with Weibull Analysis to compute failure rates.
In addition, Relyence Reliability Prediction allows you the flexibility to combine methodologies from multiple standards. For example, Relyence Reliability Prediction provides you with the ability to apply the techniques defined in Telcordia for adjusting failure rates based on laboratory test data to your MIL-HDBK-217 prediction.
Relyence Reliability Prediction
Relyence Reliability Prediction is a powerful and comprehensive package for performing Reliability Prediction analyses. As the best-in-class Reliability Prediction software analysis tool, it supports all the prediction standards and implements all aspects of each standard for complete and accurate MTBF analysis.
Additionally, Relyence Reliability Prediction goes above and beyond standards implementation with a host of features to make your prediction analyses most efficient, including streamlined data entry, default values, data importing and exporting, built-in component libraries, Intelligent Part MappingTM, data libraries for data reusability, dashboards for high level overviews, browser-based flexibility, What-If? analysis, derating analysis, allocations, integration with other RAMS tools, and much more.

If you are interested in learning more about Relyence Reliability Prediction or our integrated Relyence Studio platform, sign up today for your own no-hassle free trial. Or, feel free to contact us to discuss your needs or schedule a personal demo.