
For companies that design or manufacture devices or equipment of any kind, it is important to have awareness of how their products perform over time. Many things will degrade with age and use, especially machinery and electronics. Knowing when products are likely to fail can be a valuable asset. For example, an organization with an understanding of failure data can create a warranty that maximizes profit, or a manufacturer can use relevant data to determine when parts need to be repaired or replaced.
The type of data that refers to information about the lifetime of a product is called life data. In its simplest form, it can be a set of times that tracks when failures occur. It can be difficult to determine how to best interpret and use this data, but fortunately, there are techniques available to help make sense of all this information. One such technique that is very effective is called Weibull Analysis.
What is Weibull Analysis?
Weibull Analysis is a statistical method that interprets life data by using various distributions, which provide curves that can identify key reliability metrics, such as probability of failure over time. One of the most common distributions used is called the Weibull Distribution, named after the Swedish mathematician Waloddi Weibull.
The Weibull Distribution is prized for its versatility. It provides the ability to estimate failure rate of a system, determine reliability, and assess the probability of failure at various time points. Additionally, it can handle data exhibiting a wide range of failure characteristics, such as early life failures due to manufacturing defects or later life failures resulting from deterioration.
Other distributions, like exponential or normal, may be selected if they are a better fit for the underlying data. Once a distribution is chosen, a variety of results are available that provide helpful information pertaining to product reliability. This information can be used for many purposes, such as predicting product lifetimes, optimizing maintenance schedules, and identifying an ideal warranty period.

How is Weibull Analysis performed?
The first step in Weibull Analysis is to determine the set of life data that is to be analyzed. The most basic data set is a list of times at which failures have occurred. Additional information, such as the quantity of failures at a specific time, can also be included. Or, if the specific times at which failures occur are not known, time intervals may be used. Your life data may also contain information on units that failed due to a different mode than the one under consideration, or those that did not fail during the testing interval. In these cases, a data point can be listed as a suspension instead of a failure.
Then, an analysis is performed to determine the distribution that most closely aligns to the data, which can be done using a specialized software tool with a best fit analysis feature. This capability finds the best fitting distribution by evaluating the amount of error associated with each distribution and selecting the one with the least error. The software tool should also have a plotting capability, so that relationships like reliability versus time can be visualized, as well as an analytics calculator to provide the ability to compute a variety of informative statistics.
Advantages of Weibull Analysis
Weibull Analysis provides a comprehensive understanding of how a product performs over time, allowing for numerous ways of putting that information into action. Weibull plots can be examined to gain insight into failure characteristics. For example, if the failure rate is decreasing over time, then the product’s failures are concentrated during early life. This could be due to an error in the manufacturing process that leads to defects. Conversely, an increasing failure rate means that the product is more likely to fail as it ages, so steps can be taken to improve its durability. With Weibull Analysis, the likely causes for failure can be narrowed down, and the plan for improvement becomes clearer.
Another area where Weibull Analysis excels is in the prediction of future product performance. By extrapolating from the data, the next failure occurrence can be anticipated. This can help a manufacturer determine when maintenance needs to be done, or when new parts need to be available.

Example Weibull Analysis
To demonstrate how Weibull Analysis can be utilized, we will conduct an example analysis of conveyor belts. Suppose that we own a factory and want to test the reliability of our conveyor belts. In order to do this, we take a sample of 10 conveyor belts and let them run continuously and autonomously until failure. An example of a failure in this case may be a jam that stops the belt from running until it is manually fixed.
Gathering a Data Set
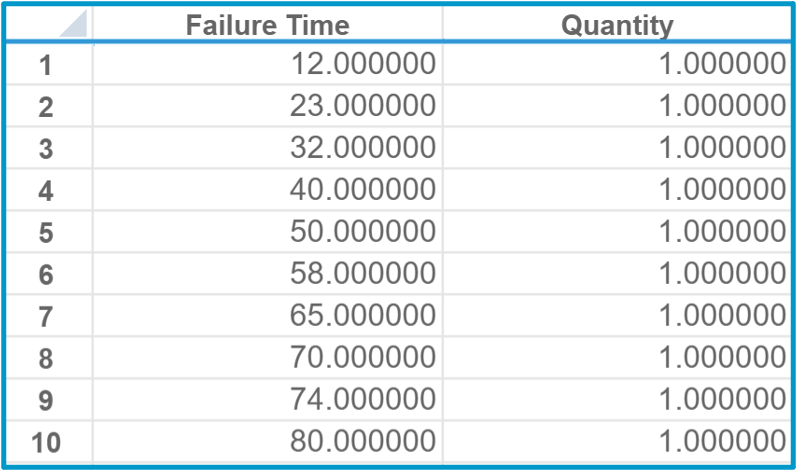
The results of the test are shown in the data set below. The unit of time is in hours. As can be seen, the belts fail more frequently as time progresses, indicating that the conveyor belts become unreliable if left running for too long without being reset, inspected, or maintained.
Determining the Best Fit Distribution
Now we need to find which probability distribution is the best fit for the data. A software tool can do this automatically by testing which distribution yields the highest correlation coefficient, which is a measure of how strong the relationship is between the distribution and the data.

Using a Best Fit analysis, we can see that the 3 Parameter Weibull distribution is the best choice. Here β, η, and γ are those three Weibull parameters, and ρ is the correlation coefficient. The software also displays ρ2, the coefficient of determination, which is a measure of how well the distribution can explain variation in the data. This value is very high at about 0.985, which means that the distribution is indeed a good fit.
Weibull Plots
A natural next step is to look at plots to view trends in the data. In this case, two graphs are helpful to get a good understanding of the performance of our conveyor belts over time: Reliability versus Time and Failure Rate versus Time.
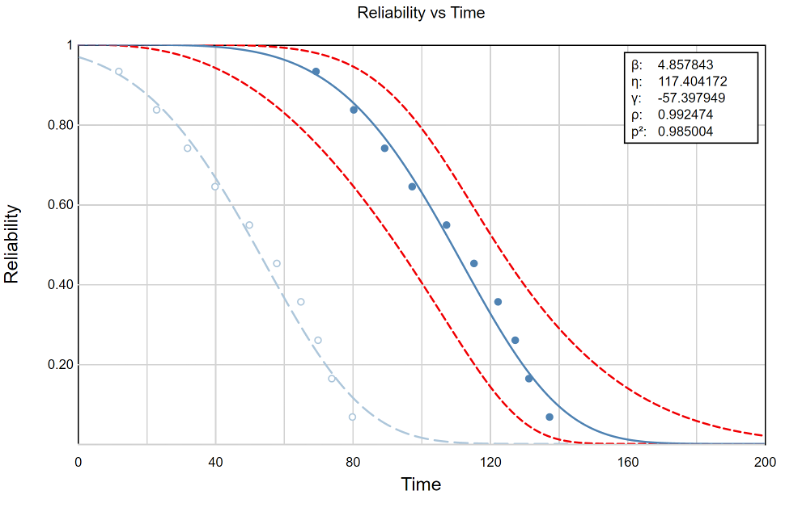
From the Reliability vs Time graph, we can see that reliability decreases over time, which makes sense — the longer a conveyor belt has been running, the more likely it is to fail. The dark blue line is the distribution curve with time shifted by the location parameter γ, while the light blue line is the distribution fit to the original data points. When reliability is calculated at a specific time in an Analytics Calculator, the output will match up with the light blue line.
This plot also includes two red lines which display the 90% lower and upper confidence bounds for our data. We can be reasonably confident that the reliability of our conveyor belts is contained within the time-scaled region formed by these confidence bounds. The larger the amount of sample data we have, the more accurate the confidence bounds will be, so the range between them will decrease.
Next, we examine our Failure Rate versus Time plot:
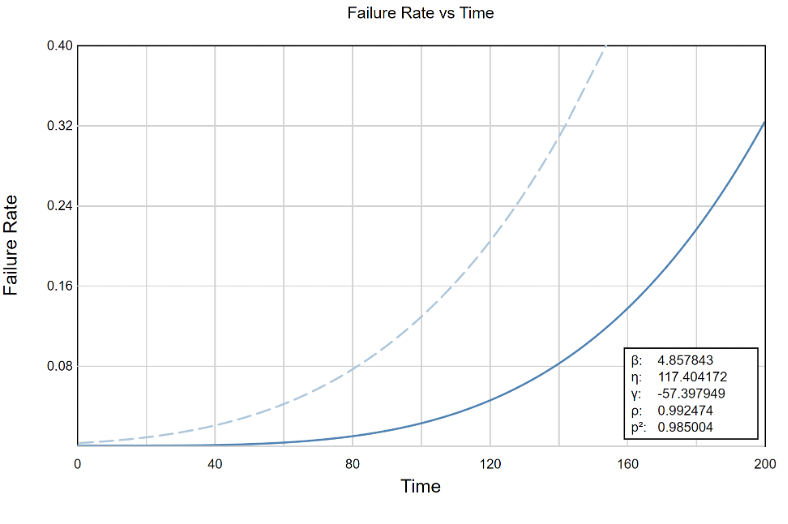
The Failure Rate vs Time plot shows a rising failure rate. This means that if we have a group of conveyor belts running, failures will become more frequent as time goes on. Like in the previous plot, the light blue line plots the values for unscaled time, and the dark blue line deals with time scaled by γ. Even without having calculated any specific statistics, we already have a good idea of the failure characteristics of the conveyor belts from a review of the plots.
Weibull Analytics
The last step is to look at more detailed and specific analytics to gather the information we need. Suppose we want to know the probability that an arbitrary conveyor belt will fail if it is used for two consecutive days, or 48 hours. To do this, we can engage an Analytics Calculator to assess the probability of failure for this time period:
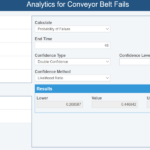
The estimated Probability of Failure (noted in the Value field above) is 0.446842, so it is almost a coin flip whether the conveyor belt will fail if it operates continuously for two days. The analysis also gives a confidence interval (the Lower and Upper values in the Results section), so we can be 90% confident that the probability a random conveyor belt fails when running for 48 hours is between 0.208587 and 0.658951. This is a wide range, however, as previously noted, the more data we gather, the more precise the results will be.
Lastly, suppose we want to know the reliability of a conveyor belt operating for 24 hours given that it has already been running for three days. In this case, we can do an analysis of Conditional Reliability as shown below:
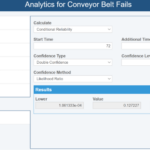
The Conditional Reliability (shown in the Value field) is 0.127227. This represents a very low reliability, so the conveyor belt will most likely fail at some point in that 24-hour period. Therefore, our results show that our conveyor belts become unreliable if they have already been active for a long time.
This example shows just a few of the many analyses that can be done on life data with Weibull Analysis. Other analytics that are useful include Mean Life, Failure Rate, Warranty Time, and more. These key metrics allow you to make smart business decisions about how a product is created and maintained.
Relyence Weibull
Relyence Weibull is a powerful and versatile software tool built to perform effective Weibull Analyses. In addition to the functionalities shown in the example analysis, Relyence Weibull has an impressive array of features for a best-in-class analysis. It can be accessed on any device and integrate seamlessly with other products in the Relyence Studio reliability and quality tool suite.

Contact us today to talk about how Relyence Weibull can meet your needs, or schedule a personalized demo at a time that works for you. If you would like to try out Relyence Weibull yourself, sign up today for our no-hassle free trial.