Testing is one of the most critical phases in the production process. It is needed to ensure the quality and reliability of the final product. A basic method of conducting tests is to take a sample of production pieces and observe how long it takes for them to fail under normal conditions. However, this technique becomes impractical when the product in question can survive for a lengthy period of time without failure. For example, some electronic components may operate smoothly for over a decade, so the manufacturer cannot simply wait to see when they fail. Fortunately, this issue can be solved through an analytical method called Accelerated Life Testing.
What is ALT Analysis?
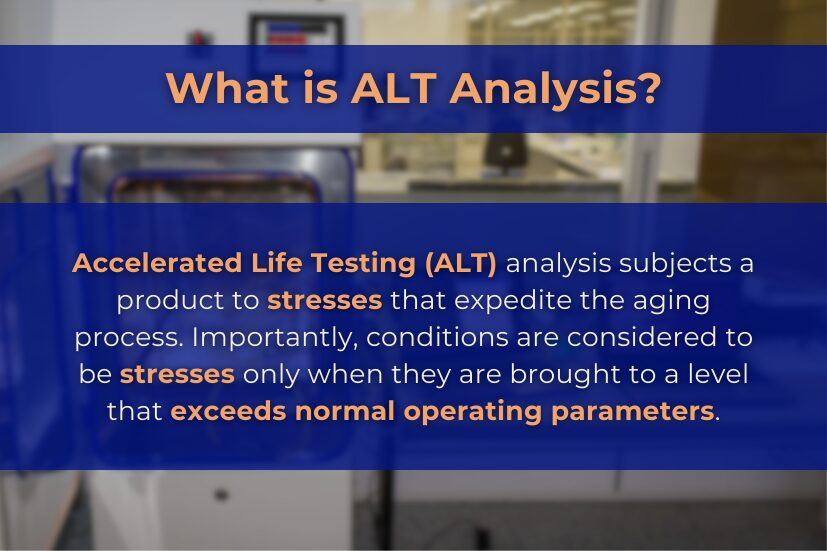
Accelerated Life Testing (ALT) is carried out by subjecting a product to stresses, which are conditions that expedite the aging process. Common types of stresses include temperature, humidity, vibration, voltage, and UV radiation. It is important to note that these are only considered to be stresses when they are brought to a level that is beyond the normal operating conditions for a product. For example, consider a simple incandescent light bulb. If it is used as intended, then voltage would not be a stress. However, if the voltage is raised above the recommended amount for the light bulb, it causes too much current to go through the filament, which produces excess heat and thus decreases the time it takes for the bulb to burn out. In this situation, voltage is classified as a stress because it reduces the life of the light bulb.
In ALT Analysis, stresses are purposefully and carefully applied in order to reduce a product’s lifespan to an observable level. If stresses are not required to test product life, Weibull Analysis may be a more appropriate technique to employ. Both ALT and Weibull Analysis can be used to obtain standard reliability analytics, such as failure rate and probability of failure. However, one of the most important results for ALT is unique: Acceleration Factor.
Acceleration Factor
The Acceleration Factor (AF) is the ratio of the failure time under standard conditions to the failure time in the accelerated test. This provides a way to estimate how long it will take on average for the product to fail when it is used normally. For example, if the AF is 100, it is expected that the product will take 100 times as long to fail in the field as it does in the accelerated test.
Applying stresses to an object can make testing time more manageable by drastically reducing its life. However, it is important to keep in mind that applying too much stress can lead to faulty data by fundamentally changing the nature of the aging process. In the light bulb example above, applying an extremely high voltage would cause the bulb to shatter, which does not match its normal burnout failure, so this procedure would yield a bad AF value. Caution must always be taken to ensure that the accelerated life of the product is representative of its true lifespan. The way that the product ages in usual circumstances can be inferred from historical data on similar or identical products.
Stress Models
Because ALT is mainly used for products where the time to fail under normal conditions is too long to be reasonably observed, the AF cannot be empirically calculated. Instead, a stress model is used to represent the relationship between a product’s life and its stresses. Below is a list of some of the most common models, each with a brief overview and how it may best be used:
- Arrhenius – This is the most popular ALT stress model. It is based on the Arrhenius reaction rate equation, which gives a relationship between a chemical reaction rate and absolute temperature. Therefore, this model is best suited when the main stress is thermal.
- Eyring – Similar to the Arrhenius model, the Eyring stress model also comes from a reaction rate equation based on temperature, the Eyring equation, so it is most effectively employed when a thermal stress is the primary focus.
- General Eyring – The General Eyring adapts the Eyring model to handle two stresses, one thermal and one nonthermal. The General Eyring is the go-to option when these stresses are not independent.
- Inverse Power Law (IPL) – The IPL assumes that the life of a product is inversely proportional to some power of stress. This model is a particularly good choice when the stress is voltage, but it also applies to other nonthermal stresses.
- General Log-Linear – This is the most versatile of all the ALT models, applicable to any type of stress. The General Log-Linear model is based on a direct proportionality between the logarithm of life and a linear combination of all the stresses.
- Temperature-Humidity – This model is a variation of the Arrhenius model that is built specifically for temperature and humidity as the two stresses, assuming that they are independent.
- Temperature-Nonthermal – The Temperature-Nonthermal model combines the Arrhenius and IPL models to work for two independent stresses, one thermal and one nonthermal.
Advantages of ALT Analysis
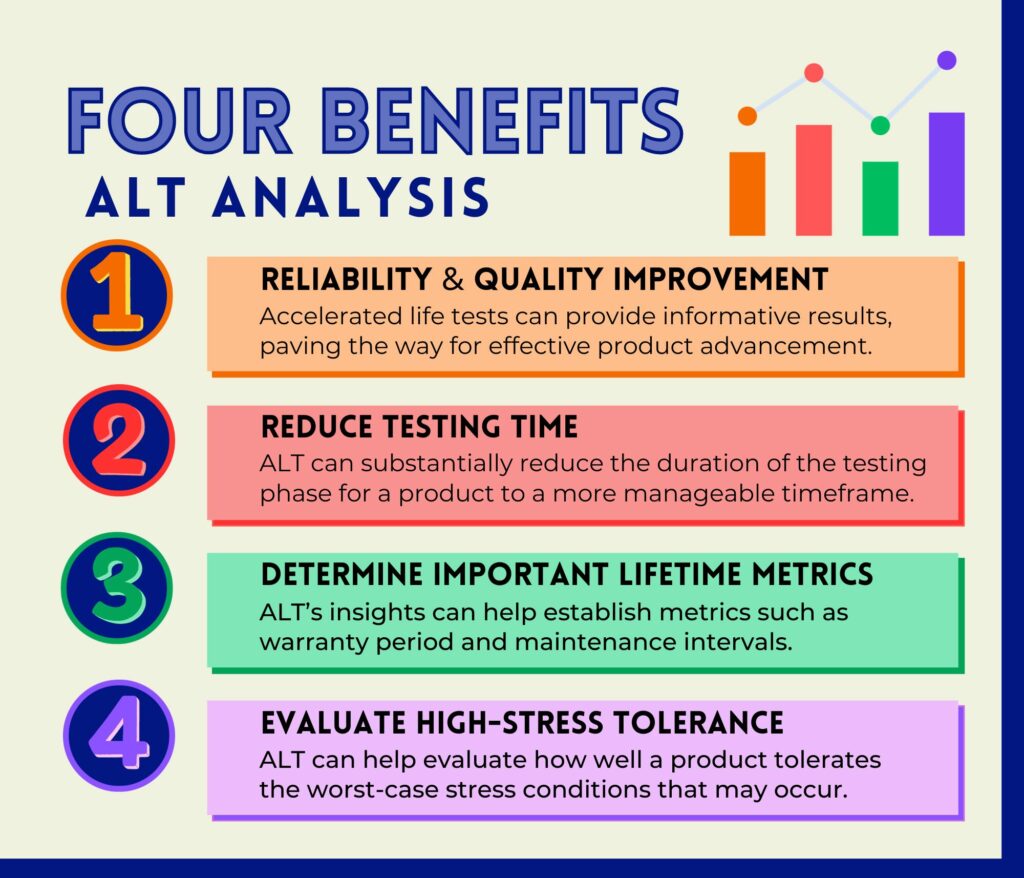
The primary purpose of ALT Analysis is product reliability and quality improvement through efficient testing analysis. With a careful application of stresses, tests can provide informative results, paving the way for effective product advancement.
Another advantage of ALT is that it can substantially reduce the duration of the testing phase for a product. When the time to fail may be too long to observe, ALT provides a way to shrink the time frame so that testing is manageable.
Additionally, ALT provides insight into how and when the product may fail whenever it is used in the field. This helps to establish critical product lifetime metrics such as warranty period and maintenance intervals.
ALT may also be used for products that are subject to high stress environments, regardless of their time to fail. In these cases, ALT can provide reliability statistics on how a product performs in its worst-case stress scenarios and help to evaluate how well a product will be able to tolerate harsh conditions that may occur.
How is ALT Analysis Performed?
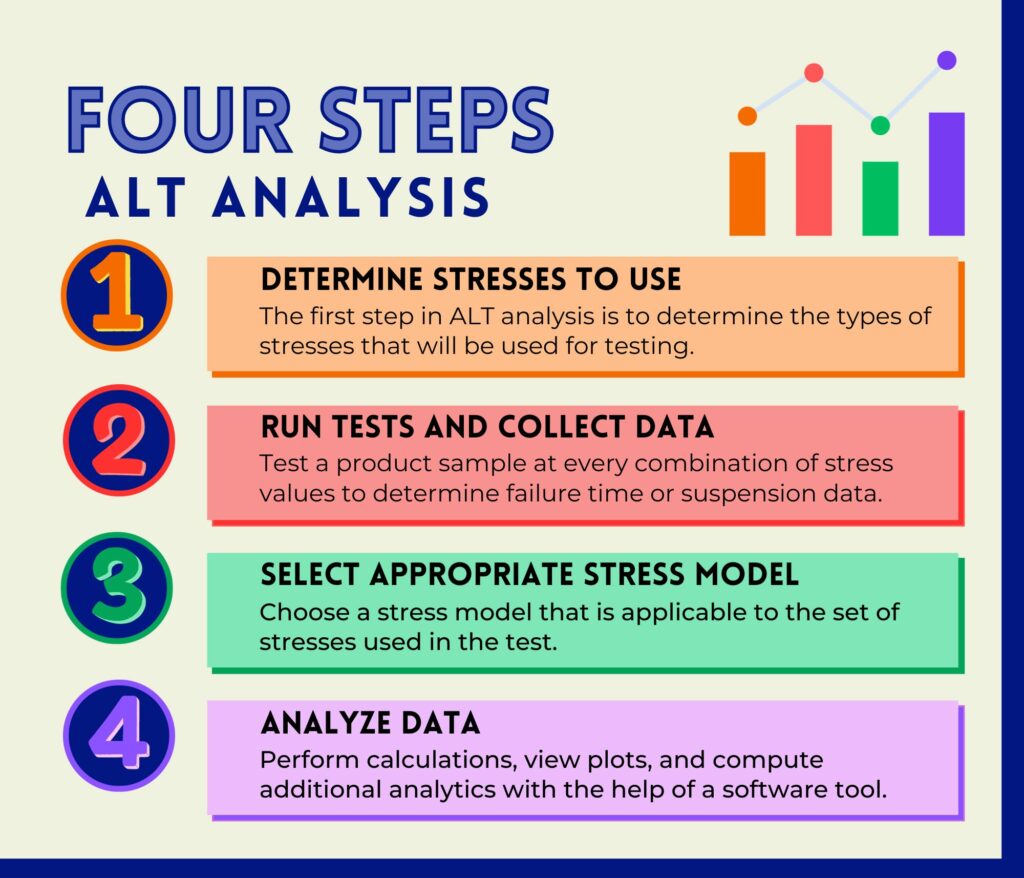
The first step in ALT Analysis is to determine the types of stresses that will be used for testing. The set of stress values to be tested should be established in advance, and if applying multiple stresses, the combinations of stress quantities need to be specified.
Next, the data can be gathered by testing at every designated combination of stress values. In the simplest case, each data point comprises the stress levels and the time to product failure. If the product does not fail during the testing interval, or it exhibits a different failure mode than the normal use case, the data point should be listed as a suspension rather than a failure.
Once the data has been collected, a stress model should be chosen. It is important to make sure that the model is applicable to the set of stresses used in the test.
From this point, a specialized software tool can do the rest of the work. A best fit analysis feature can determine the optimal distribution to represent the data. This is combined with the stress model to form the basis for analytic calculations. Additionally, the software should have a plotting capability so failure properties can be visualized over different time or stress values.
Example ALT Analysis
The example below will demonstrate the steps of ALT Analysis and show how the results may be interpreted. For this example case, assume that we manufacture a high-strength glue intended for home repairs. This glue could very well last over a year, even when bearing a large amount of weight, so we choose to use ALT to make the testing process manageable.
Determining the Stresses
Before we can collect any data, we need to determine what stresses should be used in the accelerated tests. Temperature is the most common stress in ALT, and it certainly applies here. Our glue starts to lose its adhesive properties when subject to very high temperature, so we can use that to reduce its time to fail.
There are other stresses that would be applicable as well, such as weight or humidity. Having more stresses may yield more accurate results, but they would also require a larger data set to represent the different combinations of stress quantities. For simplicity in this example, we will use temperature as our only stress.
Now, we construct the set of temperature values that will be tested. We want to have temperatures high enough to yield observable results, but we also do not want to subject the glue to such extreme temperatures that its fundamental properties change. For this example, we will test temperatures from 150 °F to 200 °F in five-degree increments.
Gathering the Data
Next, we move on to testing a product sample at each of our specified stress conditions. It is important to ensure that the other conditions besides the active stress are held constant. In each of our tests, we will observe how long one square inch of glue can hold a 500-pound block of steel. Note that weight is not considered a stress in this case because it is kept the same over all tests. The only parameter that differs between experiments is temperature.
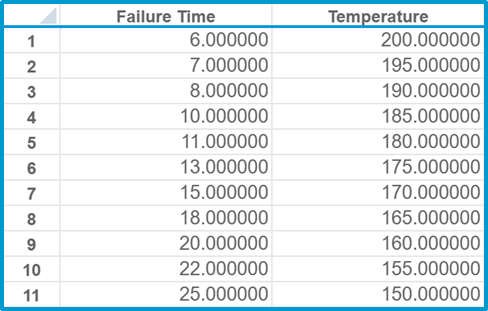
Below are the results from our tests. The failure time for each data point is how many hours it took before the glue gave way and the block fell. As expected, higher temperatures put more stress on the glue, causing earlier failure.
Choosing a Stress Model
Since our only stress is temperature, the Arrhenius and Eyring models would both be good choices. Arrhenius is the most common model choice, so that is the one we will pick in this example. Bear in mind that there may not always be an obvious selection of good models, especially if a stress is unusual. In that case, one may have to apply multiple different models to the data and employ statistical goodness of fit techniques to identify which is most suitable.
Data Analysis – Identifying the Best Fit Distribution
When it comes to determining the best fit distribution, the log-likelihood function, l(θ), is often utilized. It is a measure of how well a specific distribution explains a set of data. For each type of distribution, the one with the set of parameters that maximizes the log-likelihood function is optimal. A software tool can find the maximum log-likelihood for multiple distribution classes, and the largest of these values indicates which distribution is the best fit for the data. Below are the results we obtain for our data set:
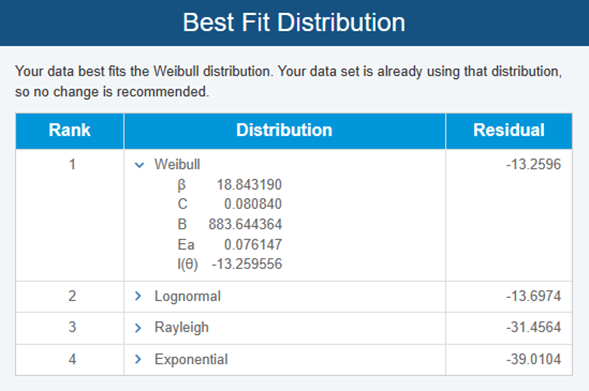
From the best fit analysis, we can see that the Weibull distribution is the optimal choice for our set of data. This is because it has the largest value for the maximum log-likelihood, which is shown next to the parameter l(θ) and in the Residual section. Below is an explanation of where the other parameters come from.
- β: This is the shape parameter of the Weibull distribution.
- C and B: These are constants in the Arrhenius model.
- Ea: The quantity Ea is the activation energy, which is the minimum amount of energy, in electron volts, needed for the temperature to start accelerating the life of the glue.
Data Analysis – ALT Plots
To generate ALT plots, we must establish a use stress. This is the level of stress that is expected to be present when the product is used normally. In our example, the glue is intended for household repairs, so we can expect it to be exposed to room temperature. Therefore, we set our use stress to 70 °F. Note that the other conditions in the test still apply, so the graphs will reflect the performance of one square inch of glue holding 500 pounds of steel at 70 °F.
The first plot we observe is Reliability vs Time:
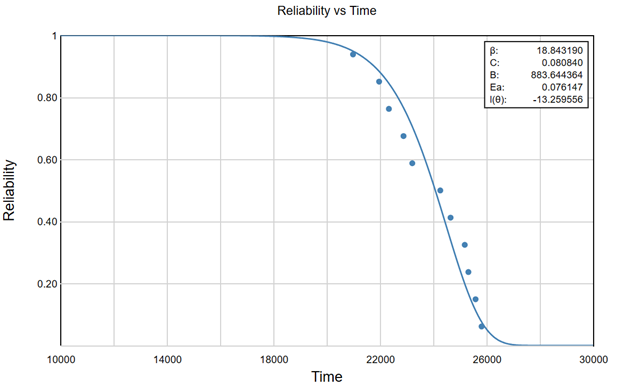
Notice that reliability is very high up to 18,000 hours, which is a little over two years. At three years, which is 26,280 hours, the reliability is very low. From this, we can expect that the bonds between the glue and the steel will start to significantly break down between two and three years of use at 70 °F.
Next, we look at Acceleration Factor vs Stress:
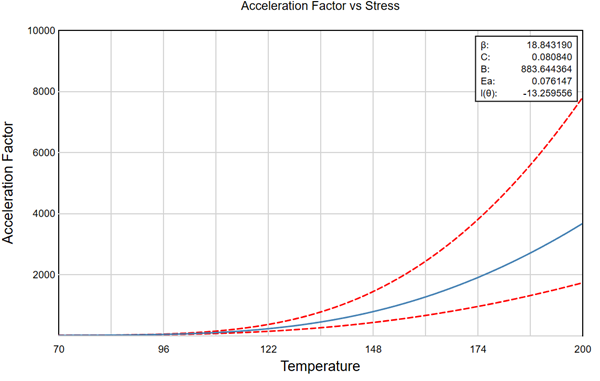
As expected, the Acceleration Factor grows as temperature increases. We can see that the higher temperatures on the graph accelerate the life of the glue by a factor that is over a thousand. This means that the duration of further tests at these temperatures will be over a thousand times shorter than it would be at room temperature, which is a drastic improvement in efficiency.
Since data samples always differ, what we see on the plot may not match up with the true Acceleration Factor for the glue. The 90% confidence bounds, drawn by the dotted red lines, give us a region where we expect the AF to reside. Notice that the gap between the bounds widens as temperature increases. This is because the higher the temperature, the further it is from 70 °F, so more extrapolation must be done, which leads to less certainty. Therefore, although higher temperatures do not require as much testing time, they necessitate a larger data set to be as accurate as lower temperatures, so there is a tradeoff.
The plots have given us insight into how our glue behaves over its lifetime and how stress accelerates its life. Other types of graphs, like Failure Rate vs Time or Standard Deviation vs Stress, might be considered as well depending on the information that is desired. For our example, we move on to calculate some specific point-based metrics of interest to us.
Data Analysis – ALT Analytics
One of the most important statistics that can be gathered from ALT is Mean Life, which is the average time a product is expected to function before experiencing failure. For this example, we want to know how long the glue lasts on average at room temperature. This can easily be computed with an Analytics Calculator often provided with an ALT Analysis software package:
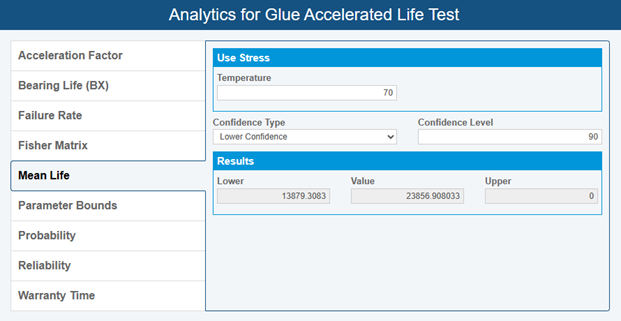
Our Mean Life calculation shows we can expect one square inch of glue to hold 500 pounds of steel at room temperature for 23,856.908033 hours, which is around two years and nine months. However, the lower 90% confidence bound value is 13,879.308300, or about one year and seven months. These two times differ widely because our data set is very small. Since ALT is extrapolative in nature, a large amount of data is needed to achieve a narrow confidence interval.
In addition to Mean Life, suppose we want to know how the glue performs on different surfaces, such as wood or plastic. Since we already have a data set to determine Acceleration Factor, we only need to test each surface at a single temperature value. If we choose 180 °F as that temperature, the Analytics Calculator yields the following AF value:
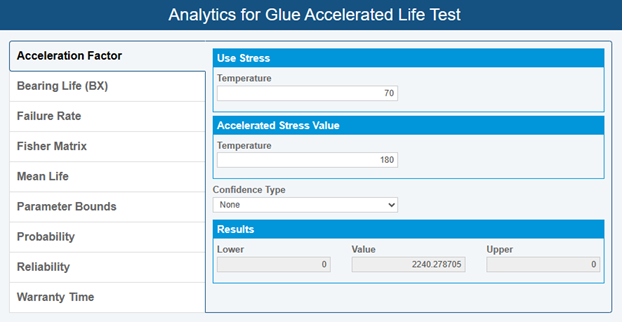
Now we can simply multiply the time-to-failure gathered in the accelerated test by the AF to obtain the expected time-to-failure in standard use. Suppose for example that the wood surface led to a failure after 8 hours in our test. Then, at room temperature, we expect it to fail in 8 × 2240.278705 = 17,922.229640 hours, which is slightly more than two years.
Aside from the calculations shown, there are other analytics like Failure Rate, Probability, Reliability, and Warranty Time, which all provide valuable information.
This example demonstrates how ALT is an incredibly effective method for reducing the time needed to test and providing key reliability statistics that otherwise would be difficult, if not almost impossible, to evaluate.
Relyence ALT
Relyence ALT is a powerful and versatile software tool built to perform effective Accelerated Life Test analyses. In addition to the functionalities shown in the example analysis, Relyence ALT has an impressive array of features for a best-in-class analysis. It can be accessed on any device and integrate seamlessly with other products in the Relyence Studio reliability and quality tool suite.
Contact us today to talk about how Relyence ALT can meet your needs, or schedule a personalized demo at a time that works for you. If you would like to try out Relyence ALT yourself, sign up today for our no-hassle free trial.