
Reliability Block Diagrams (RBDs) are one of the most widely used tools for evaluating how a system performs over time. RBD analysis begins by creating a visual representation of the system architecture, showing its components and how they interrelate. Then, metrics like reliability, availability, and downtime can be calculated based on how those components fail and interact. RBDs are especially useful for systems with redundancy, where the question isn’t just “Will this part fail?” but “Will the system still function when it does?”
But failure behavior only tells part of the story. In practice, how a system responds to failure has just as much influence on real-world availability as the underlying failure rates themselves. That response includes how quickly a failure is repaired, whether problems are caught before they cascade, and whether maintenance happens on a schedule or only after something breaks. A component may be quick to repair once a failure is known, for example, yet remain unavailable for days or weeks if that failure is hidden behind a redundant path. Modeling maintenance strategy alongside failure behavior provides a more realistic picture of how a system will perform in operation.
Relyence RBD combines an intuitive visual diagrammer with analytical calculations and Monte Carlo simulation to evaluate reliability, availability, redundancy, downtime, and more. With the ability to include Corrective Maintenance, Preventive Maintenance, Inspection, and Imperfect Repair factors in your analysis, Relyence RBD provides valuable insight into real-world system performance.
Maintenance Modeling in Relyence RBD
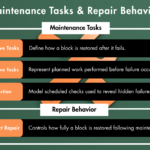
Relyence RBD supports several categories of maintenance tasks and repair settings to model how blocks are restored, inspected, and maintained over time.
- Corrective Maintenance defines how a block is restored after it fails. You specify the Repair distribution and parameters of the repair task, and you can specify when the repair occurs: immediate, upon inspection, upon system failure, or upon either system failure or inspection. This makes it possible to model the delay between when a failure occurs and when corrective action actually begins.
- Preventive Maintenance designates scheduled work performed before failure occurs, aimed at reducing the likelihood or impact of an unplanned outage. Tasks can be completed on a fixed interval based on calendar time or item age, or they can be completed when a certain condition is met—such as when life proportion reaches a defined threshold.
- Inspection models scheduled checks that reveal failures that are not immediately apparent. This is especially important in redundant systems, where one component can fail without taking the entire system down and remain hidden until an inspection discovers it or an overall system failure occurs.
- Imperfect Repair describes how fully a block is restored following repair. This allows you to account for components that are not returned to as-good-as-new condition upon repair. A Restoration Factor between 0 and 1 defines how much accumulated damage or age is removed, while Restoration Type determines whether the factor applies to the block’s total accumulated age or only the most recent operating cycle. This is most meaningful for age-dependent failure distributions, where a component’s likelihood of failure changes as it accumulates operating age.
Together, these maintenance task and repair behavior modeling capabilities make it possible to model a broad range of real-world maintenance behavior, including immediate and delayed corrective action, fixed-schedule and condition-based preventive maintenance, hidden failures, and partial restoration, giving teams a much more complete view of how maintenance timing and effectiveness influence system availability and downtime.
Example: Improving Availability for a Smart Security System
Let’s look at a smart security system monitoring a remote, unstaffed facility. Any on-site repair requires a technician dispatch, making corrective maintenance much slower than it would be at an attended site. The system also includes redundant communication paths, allowing alarm notifications to continue after certain individual failures.
The system is made up of three functional elements:
- Sensor Network. The door, motion, and environmental sensors distributed throughout the facility. All sensors must be reporting for the system to be considered fully functional.
- Security Hub. The embedded controller that collects sensor data, evaluates alarm conditions, and manages the communication paths. It is installed in an unconditioned enclosure and is subject to thermal cycling and gradual component deterioration, so its likelihood of failure increases as it accumulates operating age.
- Communication Paths. An Internet Gateway and a Cellular Modem. Either path can maintain the connection to the monitoring service, allowing alarm notifications to continue if one path fails.
The RBD has the following structure:
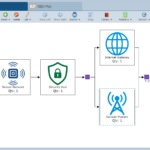
The system remains available as long as all of the following are true:
- The Sensor Network is operating.
- The Security Hub is operating.
- The Internet Gateway or Cellular Modem maintains the monitoring connection.
This architecture highlights two distinct maintenance situations. A failure in either communication path may remain hidden because the surviving path continues transmitting notifications and the monitoring service sees no interruption. The Security Hub, by contrast, fails visibly, but the risk increases with age, making it a strong candidate for proactive maintenance.
We calculate the RBD over a five-year operating period, or 43,800 hours, using Monte Carlo simulation. All blocks are configured as repairable.
The model uses the following component life information:
- Sensor Network: Exponential distribution with an MTBF of 25,000 hours and a repair duration of 24 hours.
- Security Hub: Weibull distribution with a shape parameter of 3.0 and a characteristic life of 20,000 hours, with a corrective maintenance duration of 72 hours. The shape parameter greater than 1 represents age-related wear-out.
- Internet Gateway: Exponential distribution with an MTBF of 4,000 hours and a replacement duration of 72 hours.
- Cellular Modem: Exponential distribution with an MTBF of 4,000 hours and a replacement duration of 72 hours.
For the Security Hub and communication modules, the 72-hour maintenance duration represents the full remote-service delay, including detection, scheduling, technician travel, and replacement.
Baseline Maintenance Strategy
We start with a primarily reactive maintenance strategy.
Corrective Maintenance is enabled for the Internet Gateway and Cellular Modem, but the Maintenance Trigger is set to Upon System Failure. If one communication path fails, the other keeps the system online, so replacement does not begin. The failed path therefore remains in a hidden failed state until the second communication path also fails and causes a system outage, which then triggers Corrective Maintenance.
The Security Hub and Sensor Network are also maintained reactively. Corrective Maintenance begins immediately after failure.
The baseline maintenance information is:
- Internet Gateway and Cellular Modem trigger: Upon System Failure.
- Communication-module repair distribution and MTTR: Exponential, 72 hours.
- Security Hub trigger: Immediate.
- Security Hub repair distribution and MTTR: Exponential, 72 hours.
- Sensor Network trigger: Immediate.
- Sensor Network repair distribution and MTTR: 72 hours.
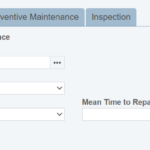
In the baseline strategy, a failed communication path remains hidden and unrepaired while the redundant path continues operating.
The baseline simulation results are:
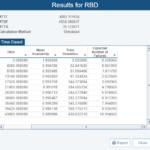
- Mean Availability: 0.989986
- Total Downtime: 438.632318
- Expected Number of System Failures: 10.094500
Adding Scheduled Communication Testing
Next, we add a recurring Inspection task to the Internet Gateway and Cellular Modem. We also change their Corrective Maintenance trigger to Upon System Failure or Inspection. Each communication path is now tested independently, allowing a hidden failure to be found and repaired while the redundant path is still maintaining the monitoring connection.
The Inspection task is configured as follows:
- Inspection Interval: 720 hours, or approximately once per month.
- Inspection Duration: 0.5 hours.
- Block unavailable during Inspection: No.
- Corrective Maintenance trigger: Upon System Failure or Inspection.
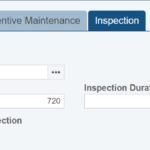
A monthly Inspection task can reveal a hidden communication failure before both redundant paths are lost.
The updated results with added Inspection maintenance tasks are:
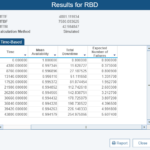
With Inspection tasks added, the results improve to:
- Mean Availability: 0.994179
- Total Downtime: 254.975866
- Expected Number of System Failures: 5.607400
Monthly testing shortens the time the system operates with only one working communication path, reducing the chance that a second communication failure causes a complete loss of remote monitoring.
Compared with the reactive baseline, scheduled communication testing:
- Increased Mean Availability from 0.989986 to 0.994179.
- Reduced Total Downtime from 438.63232 to 254.97587 (a 42% reduction).
- Reduced Expected Number of System Failures from 10.094500 to 5.607400 (a 44% reduction).
Adding Preventive Maintenance for the Security Hub
Inspection addresses failures that can remain hidden in the redundant communication paths. The Security Hub presents a different maintenance challenge—its failures are immediately visible, but they become more likely as the unit accumulates operating age.
To address this age-related deterioration, we retain the monthly communication tests and add a recurring Preventive Maintenance task for the Security Hub. The task represents a scheduled refurbishment that restores the controller to as-good-as-new condition instead of waiting for an unplanned failure and 72-hour repair.
The Preventive Maintenance task is configured as follows:
- Maintenance Type: Interval.
- Interval Type: Calendar Time.
- Maintenance Interval: 8,760 hours (1 year).
- Maintenance Duration: 4 hours.
- Block unavailable during maintenance: Yes.
Because the Security Hub uses a Weibull distribution with a shape parameter of 3.0, its likelihood of failure increases with age. Resetting effective age returns the block to the early, lower-risk portion of its life, and the annual interval keeps the hub below the point where wear-out becomes more pronounced.
However, there is a tradeoff to adding a Preventive Maintenance task. Because the Security Hub is a series element, the system will be unavailable during the planned 4-hour maintenance task. This is an important part of the comparison—Preventive Maintenance is not free, so the question is whether that planned outage avoids enough unplanned downtime to be worthwhile.
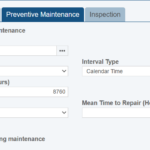
A Calendar Time-based Preventive Maintenance task refurbishes the Security Hub before age-related failure becomes more likely.
With monthly Inspection plus annual Preventive Maintenance, the results are:
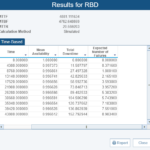
- Mean Availability: 0.996512
- Total Downtime: 152.792944
- Expected Number of System Failures: 8.983400
Scheduled maintenance introduces 20 hours (4 hours x 5 years) of planned downtime across the five-year period. Even so, total downtime fell by over 100 hours because each avoided failure would have required a 72-hour unscheduled repair visit. This tradeoff is the core argument for Preventive Maintenance—a small amount of planned outage, scheduled at convenient times, in exchange for a much larger amount of unplanned outage at inconvenient ones.
The Expected Number of Failures value increased from 5.62 to 8.98 when Preventive Maintenance was added, which can appear counterintuitive alongside a large reduction in downtime. In this model, scheduled maintenance events are counted in the metric along with unscheduled failures. Because the Security Hub is a series element and is taken out of service during maintenance, each Preventive Maintenance task registers as a system-level failure. In other words, the combined strategy produces more system-level events overall, but fewer unplanned failures and substantially less downtime.
Additionally, it is worth noting that this benefit depends on the Security Hub’s age-dependent failure distribution. Applying the same Preventive Maintenance task to the Sensor Network, which uses an exponential distribution, would produce minimal or no improvement. The exponential distribution’s constant failure rate means that resetting effective age does not change subsequent failure behavior. The planned downtime would be added with nothing gained in return.
Comparing the Maintenance Strategies
The three scenarios progressively address different maintenance needs:
- Reactive maintenance only. Communication failures may remain hidden, and the Security Hub is serviced only after failure.
- Monthly communication testing. Hidden Internet Gateway and Cellular Modem failures can be discovered before both paths are lost and the overall system fails.
- Monthly testing plus Security Hub Preventive Maintenance. Hidden communication failures are addressed while age-related Hub failures are reduced through scheduled refurbishment.
The results can be summarized as follows:
| Maintenance Strategy | Mean Availability | Total Downtime | System Failures | Unscheduled Failures | Scheduled Failures |
| Reactive maintenance only | 0.989986 | 438.632318 | 10.094500 | 10.094500 | 0 |
| Monthly communication testing | 0.994179 | 254.975866 | 5.607400 | 5.607400 | 0 |
| Monthly testing & Preventive Maintenance | 0.996512 | 152.792944 | 8.983400 | 3.983400 | 5 |
The results show why a maintenance strategy should be matched to failure behavior. Inspection primarily reduces hidden-failure exposure in the redundant communication pair, while Preventive Maintenance reduces age-related Security Hub downtime. These maintenance activities clearly improve system performance compared to reactive maintenance only.
The appropriate strategy depends on more than the highest availability value. Teams may also need to consider the effort required to perform testing, the cost of planned service visits, the consequences of unexpected outages, and the operational value of keeping redundant components ready for demand.
By modeling each strategy with the same baseline RBD and calculation settings, teams can compare system availability, hidden-failure exposure, scheduled maintenance, and unplanned repairs to find the optimal maintenance plan for their system.
Explore Additional Maintenance Options
The same smart security model can also be extended to explore additional RBD capabilities, including Imperfect Repair and redundancy as an alternative to scheduled maintenance. The maintenance tasks used in the example can also be stored in the Maintenance Task Library for reuse across other configurations or facilities.
Imperfect Repair
Rather than a full refurbishment, the annual Security Hub service could be modeled with a Restoration Factor of 0.6, representing a cleaning and partial component replacement that removes some, but not all, of the accumulated age. Comparing this against the Restoration Factor of 1.0 shows how repair effectiveness can influence long-term availability in addition to maintenance frequency.
| Restoration Factor | Mean Availability | Total Downtime | Expected Number of Failures |
| 1.0 | 0.996512 | 152.792944 | 8.983400 |
| 0.6 | 0.995534 | 195.607428 | 9.540300 |
Redundancy as an Alternative to Preventive Maintenance
Preventive Maintenance is not the only way to address the Security Hub’s age-related failures. A second controller held in Warm Standby (with Characteristic Life of 40,000 hours in Standby mode) can cover the system during an unscheduled repair or planned service, addressing the same exposure through hardware rather than through a scheduled maintenance task.
Modeling both approaches allows them to be compared on the same terms. With a redundant hub and no Preventive Maintenance, total downtime falls to 109.55 against 152.79 hours for the Preventive Maintenance strategy. Unscheduled system failures remain similar with about 3.64 with standby versus 3.98 with scheduled maintenance, but the standby unit absorbs much of the downtime. Choosing between the approaches becomes a cost-benefit decision that weighs the capital cost of a second controller against recurring service visits and the operational impact of downtime.
Reuse Tasks with the Maintenance Tasks Library
In Relyence RBD, the communication-path inspection, communication-module replacement, and Security Hub refurbishment tasks can all be saved in the Maintenance Tasks Library. Once standardized, these tasks can be reused across other security-system configurations or a larger fleet of monitored facilities, helping teams model consistent maintenance assumptions across analyses.
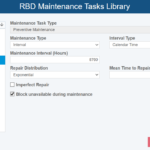
The RBD Maintenance Tasks Library makes it easy to reuse consistent maintenance task data across systems and Analyses.
Key Takeaways
This example demonstrates the benefits of incorporating key maintenance related elements when evaluating system performance using RBD analysis:
- The use of Inspection reveals failures that would otherwise remain hidden in redundant communication paths, shortening the window during which the system operates without protection.
- Performing Preventive Maintenance addresses age-related deterioration in the Security Hub before it results in an unexpected outage and a lengthy dispatch to a remote site.
- Accounting for Imperfect Repair captures maintenance that only partially restores a component.
- Redundancy can be used as an alternative way to absorb failures rather than prevent them.
By modeling when failures occur, how they are detected, what triggers maintenance, how long maintenance takes, and how fully a component is restored, Relyence RBD provides a more realistic view of system operation. This allows teams evaluate the tradeoffs among maintenance effort, hidden-failure exposure, planned service, unplanned downtime, and overall availability.
Model Maintenance Strategy with Relyence RBD
Maintenance strategy is often treated as a downstream detail, addressed only after a system’s reliability characteristics have already been established. As this example shows, it deserves the same attention as failure rate itself. A system with strong redundancy can still suffer extended downtime if a hidden failure goes undetected, and a component with excellent nominal reliability can still drive significant cost and disruption if it isn’t serviced proactively.
Relyence RBD provides built-in support that allows you to model Corrective Maintenance, Preventive Maintenance, Inspection, Imperfect Repair, and redundancy. By incorporating these maintenance strategies into your RBD analysis, you can more accurately evaluate their impact on system availability, downtime, and overall performance and compare alternatives before implementing them in the field.
Whether you’re looking to optimize an existing maintenance program or evaluate new approaches, Relyence RBD is the powerful, flexible platform you need to make informed reliability decisions with confidence. Try Relyence RBD for yourself with our completely free trial or contact us to schedule a personalized demo and learn how Relyence can help you optimize your maintenance strategy.