
Reliability Prediction is one of the most efficient ways to quantify product reliability before a single unit is built. But if you’re new to the technique, the task can seem daunting. You need to choose a prediction standard, gather design data, understand how failure rates are calculated, and evaluate software tools. Fortunately, getting started is easier than most people expect. Reliability Prediction is one of the most accessible, well-established techniques in the field, and with a solid grasp of the fundamentals, you can begin meaningful analysis right away.
This article walks through what you need to know to get started with Reliability Prediction, from understanding the basics to setting up your first analysis.
What is Reliability Prediction?
Reliability Prediction is a technique for estimating the failure rate of an electromechanical system. It relies on mathematical equations defined in well-established, published Reliability Prediction standards. These equations were developed by statistically analyzing large volumes of historical component failure data gathered over decades of field use. The result is a set of formulas that model the expected failure characteristics of components based on factors like operating environment, temperature, applied stress, and quality level.
Reliability Prediction has its roots in the defense sector, with MIL-HDBK-217 being one of the earliest and most widely used standards. Since then, its application has expanded across telecom, aerospace, automotive, medical devices, and consumer electronics—essentially any industry where product reliability matters.
To perform a reliability prediction analysis, you list the components in your system design, calculate the estimated failure rate for each one using the equations from your chosen standard, and roll up the results to the system level. The resulting predicted system failure rate may be a simple summation or may be more complex depending on your selected standard and any additional real-world performance data and adjustment factors you may have.
From there, you can derive the MTBF (Mean Time Between Failures) of your system. For equipment operating in the “useful life” portion of the lifecycle where failure rate is constant, MTBF is equal to the inverse of failure rate: MTBF = 1 / failure rate. So for example, if an electronic assembly has a predicted failure rate of 200 FPMH (Failures per Million Hours), the MTBF is approximately 5,000 hours. This means that, on average, the electronic assembly will operate approximately 5,000 hours before failing.

Why Start with Reliability Prediction?
Reliability Prediction is often the first analysis reliability engineers learn, and for good reason. Although it cannot forecast exactly when an individual product will fail, it provides a statistically consistent basis for comparing design alternatives and identifying reliability risks early in development. This is valuable because the earlier you can identify reliability concerns, the less expensive they are to fix. A design change on paper costs far less than a redesign after manufacturing has begun.
A reliability prediction analysis can help you:
- Assess the feasibility of a proposed design
- Compare design alternatives to identify the most reliable option
- Identify components or subsystems that pose reliability risks
- Perform What-If? analyses to evaluate the impact of design changes
- Track reliability improvement over time
- Meet contractual or regulatory compliance requirements
- Reduce the Cost of Poor Quality (COPQ)
Reliability Prediction can be performed at any stage of the product lifecycle—from early design through prototyping, manufacturing, and deployment—making it a flexible tool that grows with your product.

The Six Steps to Getting Started
Once you understand the fundamentals, getting started with your first analysis comes down to a straightforward, six-step process:
- Understand the standards landscape
- Gather your data
- Define your system structure
- Add your components
- Calculate and review your results
- Use your results to improve
This process isn’t strictly linear. As your design evolves, you’ll revisit earlier steps, refine your data, adjust your system structure, and recalculate along the way. Think of it less as a checklist to complete once and more as a cycle you’ll repeat throughout your product’s development. Let’s walk through each step.
Step 1: Understand the Standards Landscape
Before diving into an analysis, it helps to know your options. There are several widely accepted Reliability Prediction standards, each with its own history and areas of strength:
- MIL-HDBK-217, the original and most widely used standard, initially developed for defense applications but now used broadly across industries.
- Telcordia (formerly Bellcore), developed for telecommunications equipment and now used across many sectors.
- 217Plus, which builds on MIL-HDBK-217 but adds factors like operating profiles and process grades.
- IEC 61709, enables converting reference failure rates to your specific operating conditions using data sourced from field use, testing, or another prediction standard.
- SN 29500, commonly used in Europe for industrial, power, and transportation applications.
- NSWC Mechanical, used for predicting failure rates of mechanical components.
- ANSI/VITA 51.1, a supplement that standardizes inputs to MIL-HDBK-217.
- China’s GJB/z 299, used primarily for products sold into or manufactured in the Chinese market.
If you have a contractual or organizational requirement specifying a standard, that decision is already made for you. If not, you’ll need to select the standard that best fits your industry, your components, and your goals. It’s also worth knowing that you’re not limited to a single standard. Many organizations use multiple standards within the same analysis, applying whichever is most appropriate for a given part or subsystem.
Which Reliability Prediction Standard Should You Use?
There is no universally “correct” standard, only the one that best matches your particular situation. If you are just getting started and are unsure, MIL-HDBK-217 remains an excellent place to start because it’s widely used, extensively documented, and supported by nearly every commercial Reliability Prediction tool.

Step 2: Gather Your Data
After you’ve settled on a standard, it’s time to start pulling together your design data. The good news is that you don’t need a complete data set to begin. In fact, one of the most beginner-friendly aspects of reliability prediction analysis is that reasonable default values can be used for data parameters you don’t know yet. The minimum requirement to start is simply a list of the components in your system, which is often readily available from a Bill of Materials (BOM).
As your design matures, you’ll gather additional details:
- The overall structure of your system, broken into subsystems and units
- The specific components in each subsystem
- Operating conditions, such as environment and temperature
- Component-level operating stresses, such as voltage and current
- Lab test data or field data, if available, to refine your estimates
Start with what you have. You can always update your analysis as more precise data becomes available, and your failure rate estimates will become more accurate as you do.
Step 3: Define Your System Structure
Once you’ve selected a prediction standard and gathered the available design information, the next step is organizing your product into a logical hierarchy. Break your system down into subsystems, and those subsystems into the individual parts that comprise them. For example, if you’re analyzing a commercial drone, you might break it down into subsystems like the motherboard, the GPS unit, and the ground controller.

Example System Hierarchy
This hierarchical approach offers several benefits for someone just getting started. It helps you organize and approach your work in manageable pieces rather than tackling an entire system at once, and it makes it easier to divide the work among team members. Later, when you’re looking to improve reliability, this structure also lets you quickly pinpoint which subsystem is contributing the most to your overall system failure rate.
Step 4: Add Your Components
With your structure in place, add the components to each subsystem. If you have a BOM, many software tools let you import this data directly, saving significant time compared to manual entry. As you add parts, you’ll enter whatever specific data parameters you currently have, using default values for anything unknown.
Whether you’re using spreadsheets or dedicated Reliability Prediction software, this is where component libraries and automated part recognition become especially beneficial. As your projects grow, these features can become increasingly valuable. Look for library capabilities like built-in component libraries that automatically populate known data parameters, intelligent part recognition that can decode part descriptions, and the ability to build and reuse your own component libraries over time. These features dramatically reduce the manual effort of data entry, particularly for newcomers who may not yet know every data field a given component type requires.
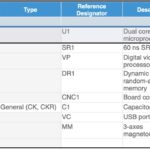
Example Component List
Step 5: Calculate and Review Your Results
Once your components and data are entered, running the calculation is typically as simple as clicking a button. The software applies the appropriate equations to each component, factoring in the pi factors relevant to that device type and standard, then aggregates the results up through your system hierarchy to produce your overall failure rate and MTBF.
Take time to review these results rather than treating the calculation as a final step. Look at which components or subsystems are contributing most heavily to your overall failure rate. This is where the real value of Reliability Prediction emerges: not just in producing a number, but in understanding what’s driving that number.
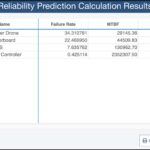
Example Reliability Prediction Results
Step 6: Use Your Results to Improve
A reliability prediction analysis isn’t a one-time exercise. Once you have initial results, use them to guide design improvements. If a particular component shows a high contribution to the system failure rate, examine which factors are driving it. A high temperature-related pi factor, for instance, might indicate a need for better thermal management or a component with a wider temperature rating.
What-If? analyses are particularly useful here. They let you experiment with adjusting certain data parameters—such as swapping in a higher quality-level component or reducing operating temperature—and immediately see the resulting impact on your failure rate and MTBF. This kind of iterative refinement is where Reliability Prediction becomes a genuine design improvement tool, not just a compliance checkbox.

A Few Tips for Getting Started
As you begin, keep these practices in mind:
- Use dedicated software. While the underlying equations can technically be calculated by hand, doing so for a system with hundreds or thousands of components is impractical and error-prone. A single design change would require you to rework your entire analysis manually. Purpose-built Reliability Prediction software handles all of the computational heavy lifting and lets you focus on interpreting results and making design decisions.
- Don’t wait for complete data. Start your analysis with whatever information you have. Default values exist precisely so that incomplete data doesn’t have to be a barrier to getting started. Then, you can refine your inputs as your design matures.
- Revisit your analysis regularly. Reliability prediction analysis is most valuable when treated as a living document that evolves alongside your product, not a one-and-done report generated at the end of a design cycle.
- Lean on libraries and automation features. Tools with component libraries, import capabilities, and intelligent part mapping significantly reduce the learning curve and the manual effort required, especially when you’re still becoming familiar with the different data parameters each standard requires.

Getting Started with Confidence
Reliability Prediction isn’t just a way to estimate failure rate—it’s a practical engineering tool for making better design decisions. Identifying reliability risks early, comparing design alternatives, and tracking improvements over time helps teams build more dependable products while reducing development costs.
Relyence Reliability Prediction brings all the widely accepted standards together in a single, streamlined platform, packed with powerful features for efficient, effective analysis. With an intuitive design and responsive technical support, new users can get off to a strong start with minimal friction.
Ready to begin your first analysis? Sign up for a free trial or contact us to schedule a personal demo. Our team is always happy to help!